Inflow’s Top Products & Categories Template
Sick of wasting your time tracking down product-specific data across multiple sources and date ranges in Google Analytics? Use our Google Data Studio template to see it all in one place.
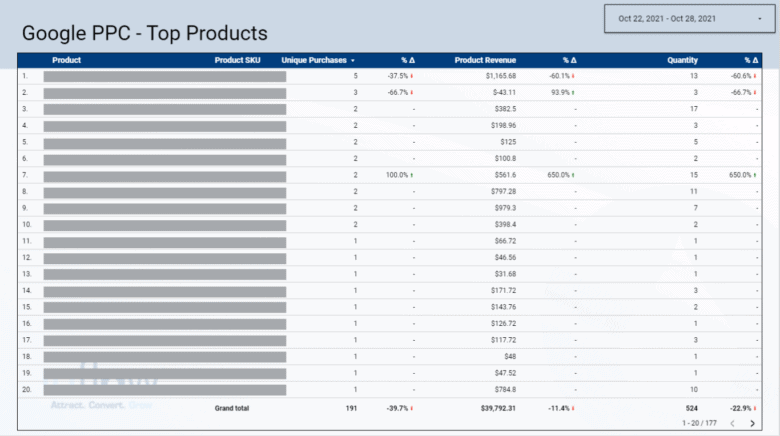
Inflow’s Top Products & Categories Template combines your sitewide, Google Shopping, and Google Search performance data into easy-to-read tables for all your marketing needs. Download the tool today for a top-level view of your customers’ buying behavior, seasonal trends, and more.
The video below is hosted on YouTube. If you need assistance with viewing the video, please contact info@goinflow.com.

Get the Top Products & Categories
Data Studio Template for Free!
Step 1
Get new free tools sent right to your inbox.
Joining our mailing list to receive our monthly Inflow Insights newsletter and weekly new content updates.Step 2
Get the tool now!
Click the button below to download your very own copy of the Top Products & Categories Data Studio Template.
How to Use Our Top Products & Categories Data Studio Template
For a more detailed walkthrough of this tool, read our full introductory blog.

Step 1: Make Your Own Copy of the Report
Note: It will appear to be broken, but the next step will fix that.
Step 2: Add in Your Data Source
Click “Create Data Source,” then choose “Google Analytics.”
Select the account you wish to pull data from (make sure you’re in the right view). Connect your data source.
Then, go back to the template. Click “Edit,” select the table you wish to populate, and then change the broken data source to your own Analytics account.
Step 3: Create Necessary Filters.
For the most accurate data, you’ll need to have appropriate filters set for Google Shopping, Google Search, and your branded Search campaigns.
If you don’t already have these created, follow these instructions:
- Keep our existing “Google / CPC” filter:

- Create a Shopping/Search/Brand filter.

Step 4: Duplicate Tabs and Adjust as Needed
If you want to see additional views and data breakdowns, duplicate a tab (or table) and add the filters, data sources, dimensions, and metrics you desire.


