You’ve Migrated to Google Analytics 4!
Now What?
Recorded Wednesday, March 29, 2023
Configuring your Google Analytics 4 tracking is one thing.
Using it effectively in your day-to-day reporting? That’s a whole other ball game.
In this co-hosted webinar, experts from Inflow and Google walk you through the most important things to know when reporting out of GA4. They share real-life examples and case studies from clients, as well as answer your biggest questions about making the most of Google’s new analytics platform.
Speakers

Mike Belasco
CEO at Inflow

Julia Morris
SEO Strategist at Inflow

Jennifer Walsh
Agency Development
Manager at Google
The video below is hosted on YouTube. If you need assistance with viewing the video, please contact info@goinflow.com.

Video Transcript
Kate Miller, Content Marketing Manager:
Welcome to our co-hosted Google Analytics 4 webinar. Inflow and Google here: We’re very excited to have you here to learn: You’ve migrated to Google Analytics 4; now what?
We have three awesome experts who are going to talk us through some topics on Google Analytics 4 of what you’re looking at, how to use it, how to make the most of it for your business.
So, we are excited to have you all here and to get through this webinar.
So, a few technical things to start.
We should have the chat open, so if you all have questions while we are going through the webinar, feel free to drop them in there. We will be gathering them throughout, and we’ll be lobbing them to our experts at the end of the webinar — to make sure that you’re getting your particular questions answered, and we’re giving you the information that you need to best suit your business needs.
So without further ado, let’s get started.
Our Google Analytics 4 Experts
As I mentioned, we have three wonderful hosts who are helping us out today and talking through some great topics and insights on Google Analytics 4.
From the Inflow side, we have both Mike Belasco, who is our CEO and founder, and Julia Morris, who is our SEO strategist and in-house GA4 specialist — both of whom are certified in Google Analytics 4 and have been working hard over the last year or so to help get all of our clients migrated.
They’ve spent collectively hundreds of hours within the platform, learning its nuances, learning how it works, so that they can best present the information for this webinar, as well as help our clients with their migrations and their recording setups. We also have a special guest here from Google, Jennifer Walsh, who is our agency development manager. She will be talking through some real-life case studies — eCommerce examples that we can look to help understand how Google Analytics 4 can help inform your business moving forward and actually enhance some of your tracking and reporting and the results that come out of that.
About Inflow
A little bit about Inflow: For those of you who don’t know a lot about us, we are a digital marketing agency that serves eCommerce clients.
We have several Google Analytics 4 certified experts on staff. In addition to Mike and Julia, we also have 100% of our Google Search and Shopping team certified in Google Analytics 4.
Both Mike and Julia have been working hard on migrations. We’ve done more than 40 of them over the last year, both eCommerce and non-eCommerce expertise.
While this webinar will be geared a bit more toward eCommerce reporting and eCommerce tracking, there will still be a lot of helpful information for those of you who may be a non-eCommerce business.
And, similarly, on that note, while this webinar does revolve around the fact that we’re going to assume that you’ve migrated to Google Analytics 4, if you haven’t yet, you’ll still find a lot of helpful information in here, as well as some recommended next steps to get you started and set up for when you get around to that. Here is our Google Analytics 4 case study that we’ve created based on some of the work that we’ve done for a couple of clients — for some light reading later on, if you all are interested in learning more about how Inflow approaches Google Analytics 4.
Webinar Topics
So, today, we’re going to be learning all about using Google Analytics 4 as your eCommerce analytics tool, both for tracking, reporting — all of that stuff.
Jennifer is going to kick us off with some case studies here shortly.
And then Julia is going to take us through some comparison of Universal Analytics versus Google Analytics 4 data, how those metrics stack up against each other, and what you really need to know before you start looking at the comparison between the two platforms.
Once she’s through that, Mike will take us into some more in-depth, detailed reporting looks, as far as orienting yourself and Google Analytics 4 and understanding what you’re really looking at when you’re in the platform.
He’s also going to take us into some live examples, both in the Google Analytics 4 demo store, as well as within some in-house reports we have here for Inflow, just to give you an example of some of the capabilities of the platform and what it would look like as you’re actually going through it.
And then to wrap it all up, we’ll recommend some next steps for those of you, depending on whether or not you’ve migrated, or you have not migrated yet.
And then we will finish it out with everyone’s favorite section, which is the Q&A. If you have any questions throughout this webinar, feel free to drop those into the chat, and we will make sure to answer as many as possible when we get to the end of this webinar.
So, all of that said, I am going to pass it over to Jennifer Walsh from Google. She is going to talk through some real-world success studies about the power of Google Analytics 4.
Google Analytics 4 eCommerce Case Studies
Jennifer Walsh, Google Agency Development Manager:
My name is Jennifer Walsh. I’m an agency development manager at Google. And what that means is I work with our premier partner agencies like Inflow on their clients’ Google Ads accounts.
We’re gonna just share some real-world success studies of how companies actually use GA4 to really have some business impact.
Bauer
So, we have a case study here for Bauer. They are a German online home and fashion retailer. Their goal is to drive more sales.
They explored GA4 new audience capabilities and utilized these insights to gain more data about their shoppers. This led to increased sales without actually increasing their cost.
They use three predictive, likely seven-day-purchasers audiences: first-time purchasers, regular purchasers, and churning users. They worked with their agency to create and test these audiences.
They saw some pretty impressive results here. They increased sales about 56% compared to their existing targeting. That’s impressive enough, but their conversion rates also grew 87%. And their cost per order decreased by over a third.
They were able to really use GA4’s machine learning and artificial intelligence capabilities to gain more data about their users, which allowed them to optimize their ads, campaigns, leading to more sales at a lower cost.
GymShark
You have a similar interesting story from GymShark. They’re a premium online fitness apparel brand. They basically wanted to create an app for their shoppers to give them a more personalized experience.
So, first, they had to set up proper measurement to collect privacy safe first-party data. They added custom parameters to the data to get detailed insights on their users.
They also utilized the exploration reports to find new insights that they weren’t even considering or looking for. This really enabled them to reveal pain points in their shopper’s journey and hopefully make it easier for them to purchase.
They had some great results. They were able to consolidate their data-processing tools from five different ones to just GA4. They also spend about 30% less time analyzing the user journey. They doubled the amount of data they were collecting on their users in a privacy-safe way, which led to 9%, fewer drop offs at checkout and 5% more page click-through rate.
They were able to use this data to really make the shopping journey easier for their customers, leading to this overall increase in revenue for their company.
Everyone on this webinar is already cutting edge, and you’re working with a very advanced agency. But there’s still a lot of room for early adopters to see great results and gain a competitive advantage from GA4 now; not a lot of people are actually really utilizing it to its full potential yet.
UA vs. GA4 Data & Metrics
Kate Miller, Content Marketing Manager:
Thank you, Jennifer. Appreciate it. Lovely to see those case studies of how things actually can come about from Google Analytics 4 and the different powers that it can give you from a tracking and reporting standpoint.
So, now that we have that sort of understanding and background of what GA4 can do, I’m gonna pass it over to Julia Morris, who’s going to tell us a bit more about how to compare your Universal Analytics and Google Analytics 4 data to understand how they can stack up against each other moving forward.
Julia Morris, SEO & Lead Analytics Specialist:
Thanks, Kate. And thank you, Jennifer, for illustrating just how powerful of a tool GA4 can be.
However, before Mike gets into showing us just how we can use all this GA4 data, we need to take a step back and go back to the basics and talk about what some of these basic metrics are in GA4.
So, the metrics here that we’re going to talk about are:
- Users
- Sessions
- Engagement Rate
- Bounce Rate
- Conversions
- Transactions/Purchases
You might think these metrics are the same as UA, but they’re not entirely. There’s some different data definitions, different collection metrics, and some of these metrics are entirely new.
Users
The first metric here we’re going to talk about is users.
In Universal Analytics, users is just the total number of users. However, in GA4, there’s a couple more metrics: total users, which is the total number of unique users who have logged an event; new users, which is the number of users who interacted with your site for the first time; and active users, which is the number of users who have an engaged session.
There’s going to be a couple of differences between your GA4 users and your UA users. GA4 uses Google Signals. So, it’s superior in figuring out that a user might connect across devices. It might see a user who logs in from their phone and then their computer. GA4 is actually able to connect those sessions into one user using Google Signals.
The video below is hosted on YouTube. If you need assistance with viewing the video, please contact info@goinflow.com.

So, your total number of users in GA4 might be a little lower.
Sessions
The next important metric to talk about is sessions.
GA4 sessions are pretty similar to UA in that they are a period of time in which the user is on the site and ends with about 30 minutes of inactivity unless the setting is changed. Similarly, if a user comes back after the session timeout, it will start a new session in both UA and in GA4.
However, in GA4, sessions are not restarted at midnight, or when new campaign parameters are encountered. Therefore, we expect GA4 to actually have fewer sessions.
We do generally expect to see this number within 10%, but that’s not always the case. There might be filters or maybe tag coverage issues that’s worth looking into further if the difference is significant.
Engagement Rate
The next really important metric to understand is engagement rate. Engagement rate is an entirely new metric to GA4 and was initially the answer to the Universal Analytics bounce rate.
Engagement rate is the percentage of sessions that were engaged sessions.
Now, natural question here is, “What is an engaged session?” A engaged session is just a session that lasts longer than 10 seconds, has a conversion event or has at least two page views or screen views.
Bounce Rate
Now your next question here is, “Hey, I thought GA4 had bounce rate. What’s that about?” And that’s true.
However, this is arguably the metric where you’re going to see the largest difference between Universal Analytics and GA4.
A Universal Analytics bounce rate is simply a percentage of single page sessions in which there is no interaction with the page. However, in GA4, that changed. A GA4 bounce rate is the percentage of sessions that were not engaged sessions. In other words, it is the inverse of the engagement rate. It’s also not included by most standard reports by default; however, it can be edited into many of these reports.
In general, we recommend looking at the engagement rate before the bounce rate in GA4.
Conversions
The next really important metric that we need to talk about is conversions and how they compare to UA goals.
A conversion is just any user-defined action that is valuable to your business. Really common examples of this are going to be items that make you money, like purchasing from your store, subscribing to your newsletter, filling out your contact form.
This is a really similar idea to the Universal Analytics goals. However, they’re not going to line up one-to-one. Just because something was a goal in Universal Analytics does not necessarily mean you’re going to be tracking it as a conversion in GA4. You might only be tracking it as an event and not as a conversion.
The video below is hosted on YouTube. If you need assistance with viewing the video, please contact info@goinflow.com.

Additionally, even if you are tracking the same event as both a conversion in GA4 and a goal in Universal Analytics, they won’t necessarily line up one-to-one. GA4 removed the restriction on a goal firing more than once per session. So, if someone fills out your contact form twice in one session, Universal Analytics will likely only count that once, while GA4 is going to count this twice.
Therefore, there can be some pretty significant differences in your total number of conversions and your total number of goals in Universal Analytics.
Transactions & Purchases
Finally, we get to transactions and purchases.
Now, GA4 and Universal Analytics have very different ways of collecting this data, which can account for some differences. However, assuming that they’re both set up well, we do expect them to be relatively similar.
In the example down below, that is the same client, the same timeframe: 468 purchases vs. 465, very similar. The difference in revenue is likely just from those purchases.
Purchases (GA4)
468
Revenue (GA4)
$129,909.57
Transactions (UA)
465
Revenue (GA4)
$130,429.20
However, where this can get confusing is GA4 will likely never perfectly match your eCommerce platform, and your platform will almost certainly have a higher number of transactions and revenue in GA4 for a variety of reasons.
Some of these common reasons can include: browser extensions that block UTM or GA4; users choosing not to opt into tracking; strict privacy settings in your browser; users leaving the site before GA4 can register their purchase, but after the eCommerce platform registered their purchase; JavaScript being disabled in browsers.
Unfortunately, there is no one number I can tell you here as an acceptable margin of error. And that’s because this can really vary wildly depending on your industry, your audience, your location.
The video below is hosted on YouTube. If you need assistance with viewing the video, please contact info@goinflow.com.

We do have some experience with working to get your GA4 closer to your eCommerce platform. So, if that’s something you’d like to talk about in more depth, I really encourage you to reach out to us. There’s some contact information towards the end of this presentation.
So, in summary, comparing your UA and GA4 data is really comparing apples and oranges. You can’t compare these one-to-one. Really, here, we recommend focusing on the trends and not on the exact numbers when you’re looking at year-over-year data, comparing UA and GA4 metrics.
They just don’t line up perfectly. Differences are going to be there.
Kate Miller, Content Marketing Manager:
Awesome. Thank you so much, Julia.
I know that is a lot of information to throw at all of you. As we’ve mentioned before, and I’ll mention again for those who are trickling in, this webinar is being recorded. So, you will have an opportunity to rewatch this recording and really dive into those metrics a bit more and understand them a bit more thoroughly. And Google does have some great resources within its own resource library to help you understand those metrics, as well. So if you’re looking for more information on that, some more context, we’d point you there as a great place to start.
Orienting Yourself in Google Analytics 4
Kate Miller, Content Marketing Manager:
But, now that we have all of that kind of context and information, I’m going to pass it off to Mike, who is going to show us a bit more about looking into GA4 and getting into those data points a bit more in detail.
Mike Belasco, CEO & Founder:
Julia, I think you did a great job there teaching us how to walk before we run. And, so we’re going to be gradually increasing our pace here as we go through the rest of this deck, getting towards hopefully some of those results that Jennifer pointed out in her case studies.
So in terms of orienting yourself in GA4, what you see when you look at reports in GA4 may not be exactly what you expect it to be.
What I want to point out in this section is the things that you really need to expect going into GA4 that I think will help you really understand your data a lot better and make decisions based on good data, not looking at the wrong thing.
Session Counts
So the first thing that we’ll talk about, and this comes as a surprise to a lot of people: the session counts that Julia was talking about earlier. One of the other reasons that they can vary a little bit from Universal Analytics is that they are actually estimated session counts. They’re estimates of unique session IDs that are generated.
They’re supposed to be good estimates, plus or minus 2%. And so, for most reporting and things like that, they’re probably good enough.
However, if you’re doing more granular, deeper analysis, you really need the actual dataset, not estimates. If that is the boat that you’re in, you will need to connect your GA4 to BigQuery and pull your analytics data from BigQuery.
And we’ll be talking more about some of the differences between BigQuery and the data that you get there versus some of the other places and Google Analytics 4 in a little bit.
“Areas” of Google Analytics 4
The next concept I think that’s really important to understand is what we call the “areas” of GA4.
Standard vs. Exploration Reports
If you’ve gone in there and played around with things, you can get into standard reports, which is, kind of, where it’s more similar to Universal Analytics: You go in, you pull up a report, you look at it. There’s also exploration reports, which is the custom reports on steroids, I guess you could say. A lot of different tools in there to utilize to analyze your data. You might be pulling your data via API into Looker Studio or some other tool, or as we alluded to earlier, you might be pulling data from BigQuery.
The video below is hosted on YouTube. If you need assistance with viewing the video, please contact info@goinflow.com.

The important thing to know and why it’s important to understand each of these different areas is, depending on where you are and where you’re looking at the data, you may actually see different data where you expect to see similar data.
So, one example would be in exploration reports: Those are much more likely to be sampled data than what you would find in your reporting in your standard reports.
Or if you’re looking at BigQuery, like we alluded to earlier, you’re not going to have the layer that Google Signals puts on top where it’s connecting users. So, your user counts in BigQuery are actually going to be different than what you would see in the standard reporting section or in the exploration reports.
Thresholding
This might be something that you’ve run into as you’ve poked around your accounts and your property in Google Analytics 4: thresholding. I guess you could call thresholding the new sampling, if sampling was ever a problem for you in Universal Analytics.
There’s still some sampling in GA4 — but, as I mentioned, it’s mostly from our experience in the explorations versus the standard reports.
However, thresholding can really throw a damper on things where it’s withholding, essentially, some of your data.
Let’s say you’re looking at a channel user acquisition report, and you’re looking at channels that sent traffic to your website. Some of the ones that didn’t send very much traffic might get grouped into an “other” category, and they’re just not shown in your report. In fact, some of the metrics aren’t even there to be calculated, etc.
If you are seeing this, and you do need more granular data and really want to see as much as you possibly can, we have a fix for you, and that is to change your reporting identity.
Reporting Identities
So in the admin section of Google Analytics 4, you have the ability to change what Google calls your “reporting identity.” And this, essentially, is how Google identifies users.
There’s three different methods to choose from. Google provides a description of each one.
Blended is the default when you have Google Signals turned on. And it’s going to use all these things that you see listed here to try and, again, figure out, “Hey, is this user coming from this browser the same user that came from this phone browser?” or whatever the case might be.
Observed looks at a few less things than blended to try and figure that out.
And then there’s device-based. Iif you want the granular level data that you’re looking for, you need to choose device-based. And that is going to ease up quite a bit on the thresholding. Most of the issues that we’ve seen with thresholding have gone away when we’ve made that change.
The good news is you can switch back and forth. When you do have device-based selected, you don’t get some of the benefits that you would with blended — and, you know, if you’re trying to do user analysis, for example, you probably want to make use of blended.
Again, if you’re trying to do real granular analysis, like a content audit for SEO purposes, then you’re going to want to use device-based.
Keep in mind, when we talked about those areas earlier, that your choice here will actually affect other areas, including the API, which is, of course, where Looker Studio pulls its data from.
It’s a little strange to be able to change the setting and have it essentially change the report in Looker Studio. That’s kind of how this works.
In addition, this will not affect BigQuery. BigQuery’s kind of its own little thing. It’s clean of these things, if you will. And so, it’s not going to change anything that that happens over in BigQuery.
Channel Groupings
The next thing you should orient yourself around is channel groupings — and specifically the default channel groupings in GA4.
The first thing that you’ll notice is that there are now a lot more channels available than in Universal Analytics, and some of the channel definitions have changed. That means that you may be expecting to see your traffic show up under a certain channel, but it actually ends up showing up under a different channel.
And, up until very recently, we did not have the ability to create custom channel groupings to change some of those definitions and get it to look more like what we would expect.
But now, as of a couple of weeks ago, we do have that ability. And, so, you can create your own custom channel groupings and modify some of the rules here. I would definitely suggest clicking on that details and definitions link; you’ll see this table that we have here.
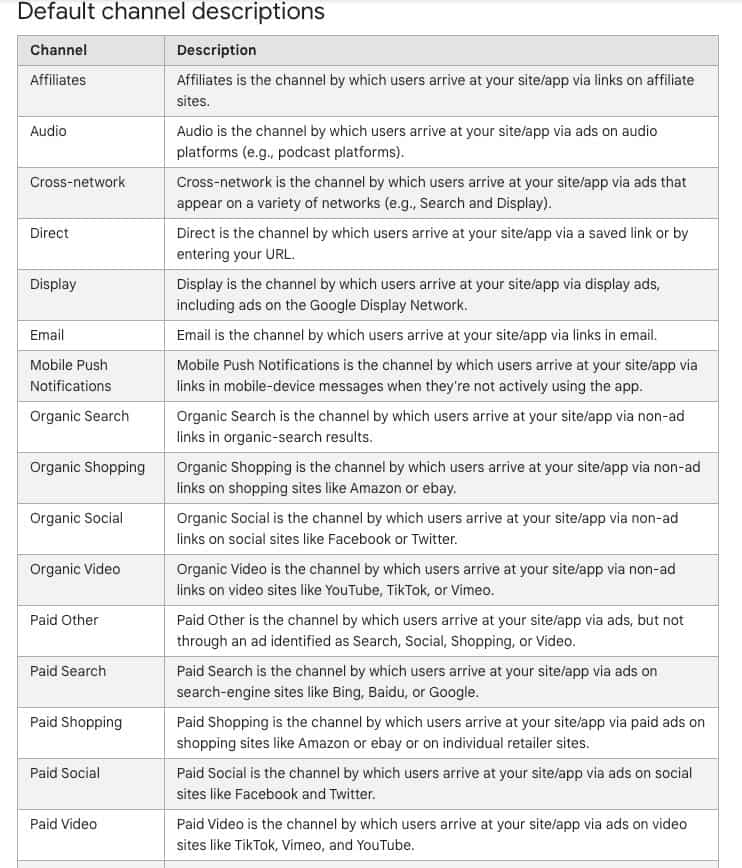
Google really gets into the specifics of what qualifies, for example, as affiliate traffic, what qualifies as organic search traffic, so on and so forth — definitely worth really familiarizing yourself.
Attribution Models
And lastly, in this section, we’ll talk about the attribution model.
You do have the ability, like in Universal Analytics, to choose the attribution model that you want to use. Unlike Universal Analytics, data-driven is the default attribution model that shows up in GA4. That, of course, differs from Universal Analytics, which used the last-click non-direct method.
The other thing that you should know here — probably not surprising, hopefully, at this point — is that what you select here only applies to some reports and other areas of GA4.
And we’ll get into that here in just a few minutes when we get into some live examples in Google Analytics.
Google Analytics Reports in the Wild: Live Examples
Now that we understand some of the basics about the metrics and we understand how to orient ourselves and have a little bit better idea of what we’re looking at when we look at reports in Google Analytics, let’s look at some live examples, and see where we can find some of this stuff.
The examples that we’re going to look at: We are going to look at how to create audiences from those predictive metrics that Jennifer talked about in the case studies. Everyone always wants to know the cool stuff first, so we’ll go over that and see how to use some of those methods.
We’ll look at how to find your best landing pages. They’re not too hard to find these days. However, there’s still an issue with the landing pages report, so we have a little hack to help you fix that issue that you have right now.
We’re going to look at how to analyze your product and category sales in the standards reports section.
We’ll stay in standard reports and look at identifying the channels that are making you the most money.
And then we’ll switch over to exploration reports and see how to build an eCommerce funnel and how to analyze that funnel, as well as how to identify the most popular site conversion paths, including a really cool new feature in pathing called reverse pathing in GA4.
How to Build Predictive Audiences
So, first, with audiences and these predictive metrics.
To get here, you would go into the admin section of GA4 and click on “audiences” in the lefthand menu. From there, you’ll be given a choice to build a new audience.
As you can see here, there’s a few different tabs. There’s general, templates, and predictive.
If you go to predictive, you might see some of these ready-made predictive audiences that you can choose to use and potentially modify. They’ll either say “ready to use,” like you see here in green, or “not eligible to use.”
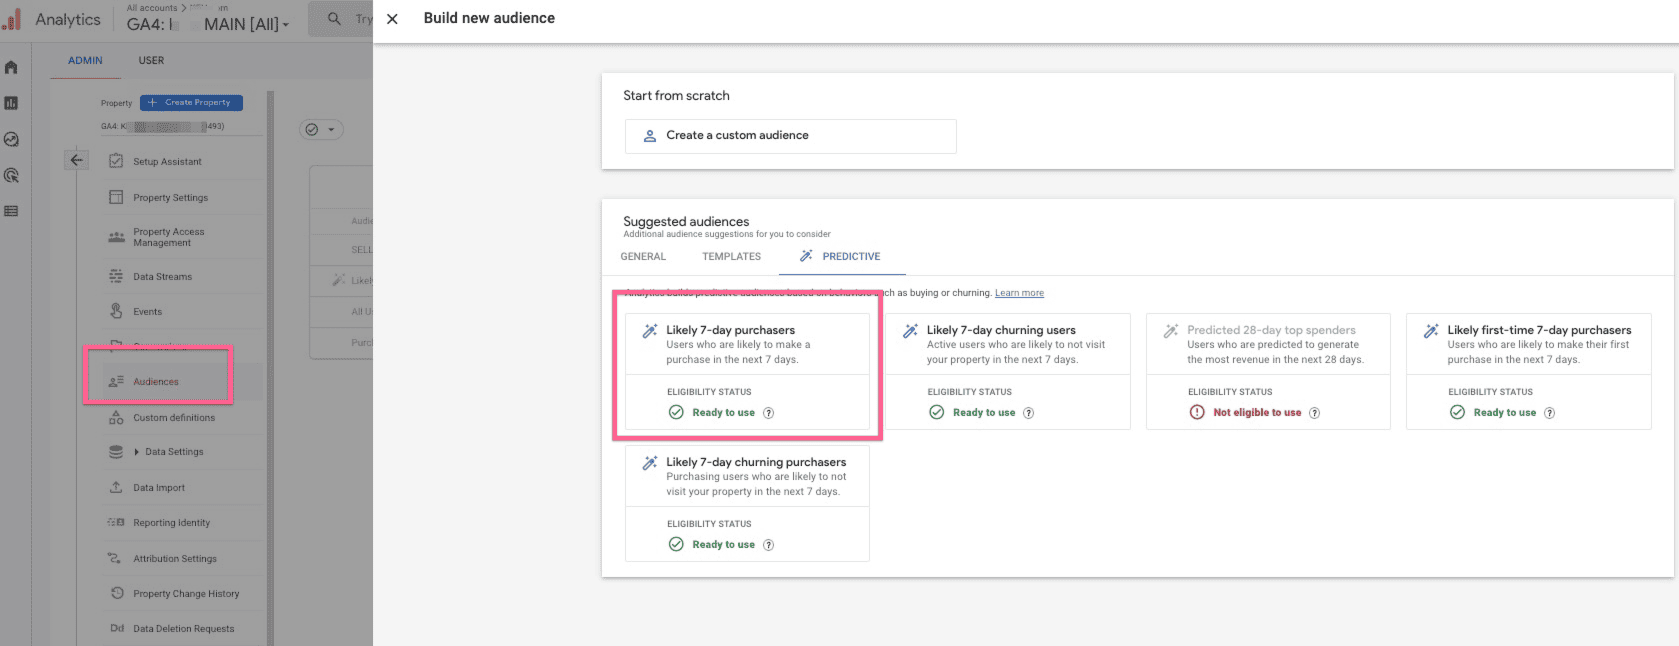
The reason that one of these audiences wouldn’t be eligible to use is that Google just doesn’t have enough data to accurately predict what they’re trying to predict — either that these people are going to purchase within seven days or churn within seven days, meaning they’re going to browse and not buy, not even come back to the website, so on and so forth.
In addition, this can change; it’s a little bit of a moving target. So, if you’re just on the cusp of having enough data in some of these, watch that because these things can come and go.
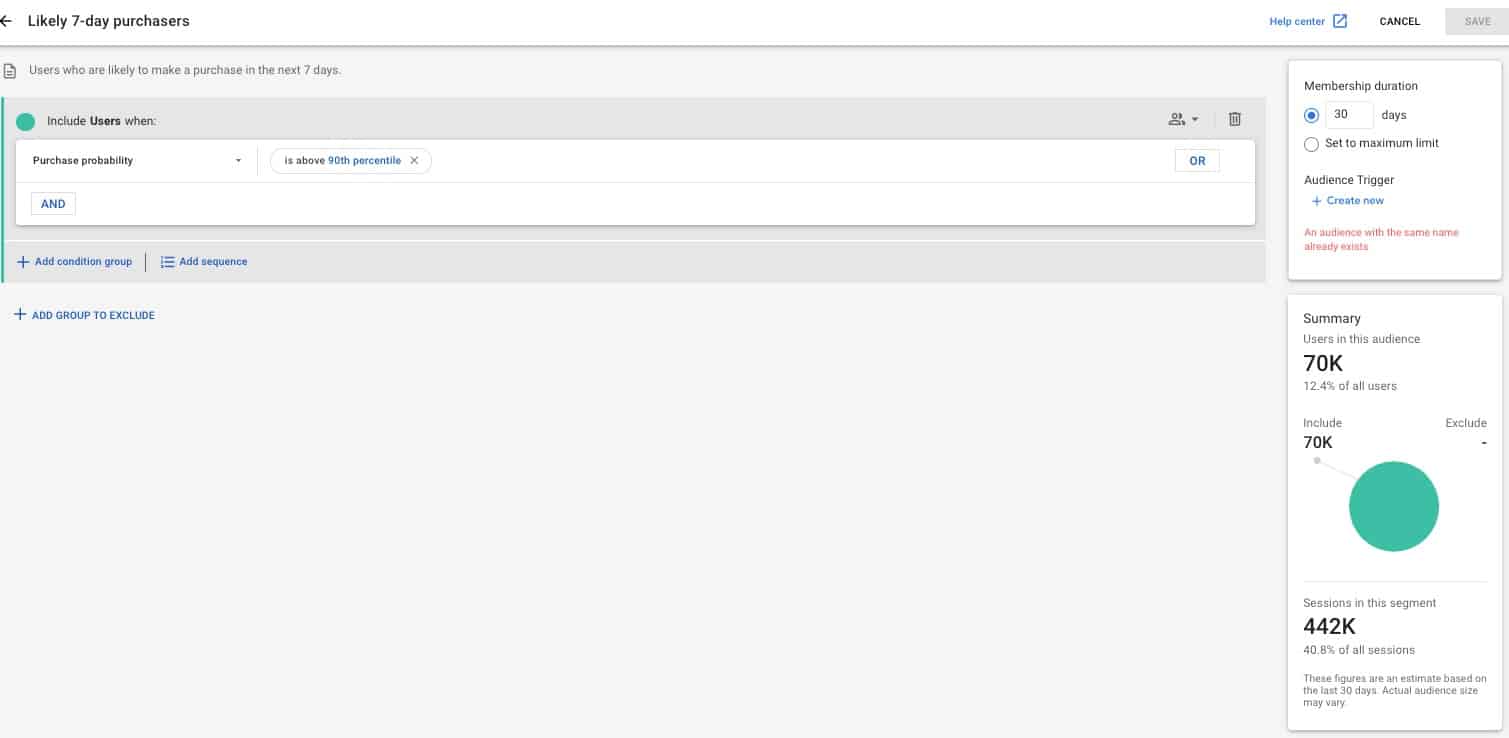
To give you a little bit of a sense of what this looks like and how you can modify it, if you dig into this audience, you can choose what level you want that purchase probability to be.
In this case, for likely seven-day purchasers, it’s defined as above the 90th percentile — but let’s say you want to expand that a little bit. You could change that to 80%, 70%, so on and so forth.
You can also add other metrics and things to filter on and create your own audience that’s going to work well for your business with predictive metrics.
How to Find Your Best Landing Pages
Now, we are going to take a look inside Google Analytics 4.
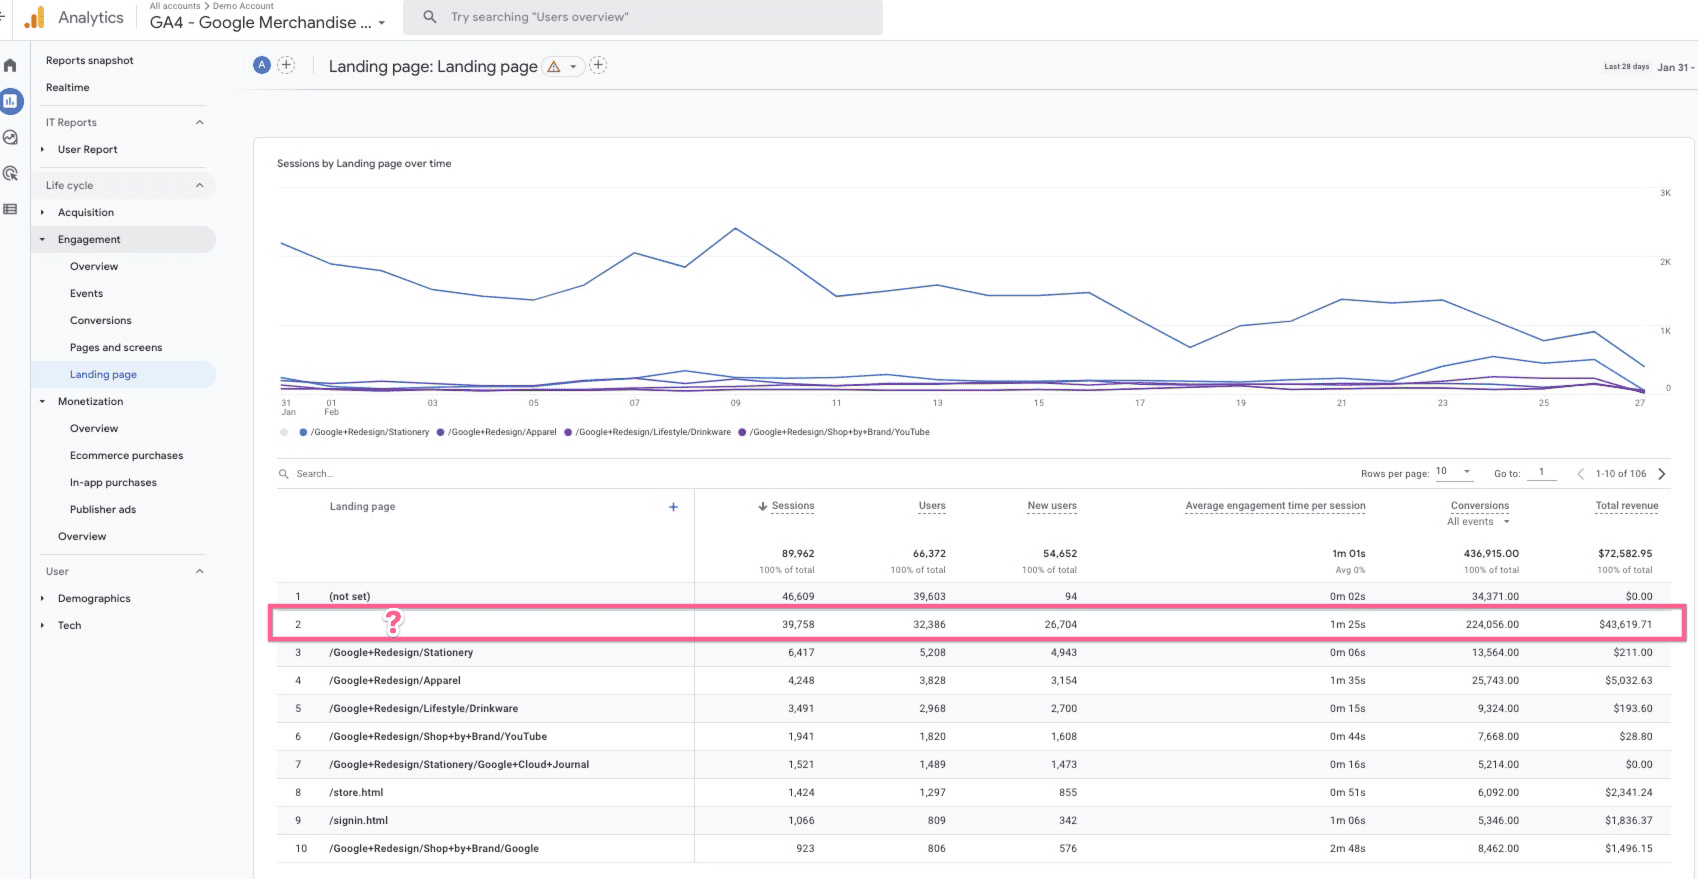
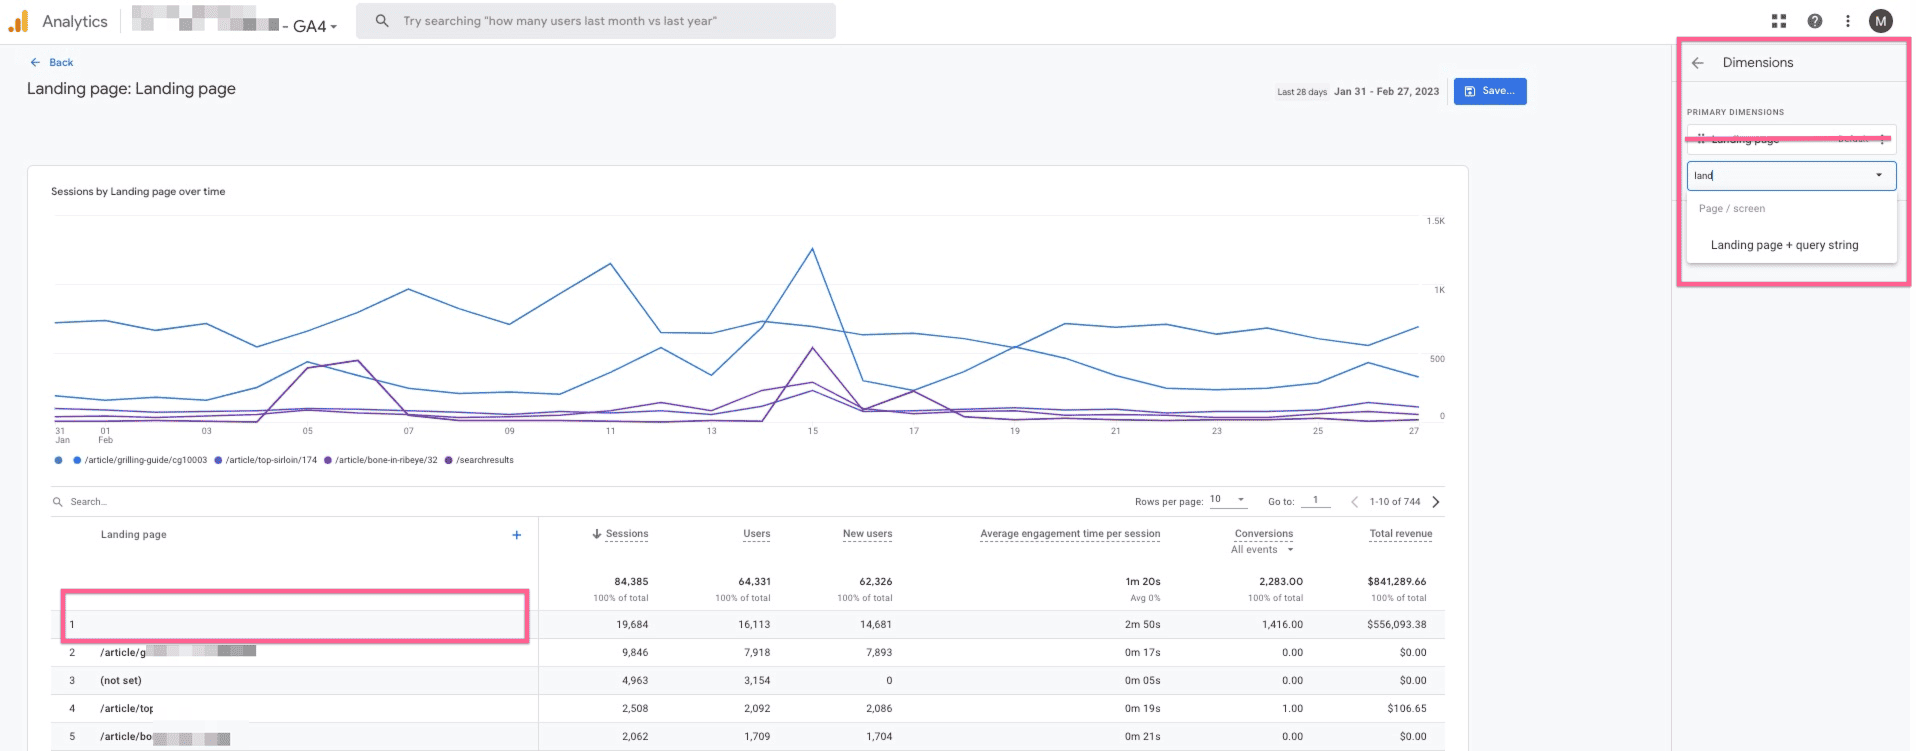
The first thing we want to look at is that landing page report and that little hack. If you come into any landing page report — this wasn’t originally in Google Analytics 4, so if it’s been a while since you’ve been in here, there is a landing page report that GA4 has rolled out. It’s not perfect, though.
One of the issues that you might immediately see is that there is a blank row here. You may be thinking, “Hmm, you know, is that the homepage, what exactly is that?” It’s not real clear.
There are a couple of different ways you can fix this.
But the way I like to fix this, since it’s kind of what I want to be a permanent fix, is to come in and customize the report by clicking on that little pencil icon. Then click on “dimensions,” and choose “landing page plus query string.”
Then go ahead and get rid of the landing page dimension, and this is going to make your new primary dimension this report: landing page plus query string. And then apply this.
What you’ll immediately see is that that slash starts to show up now.
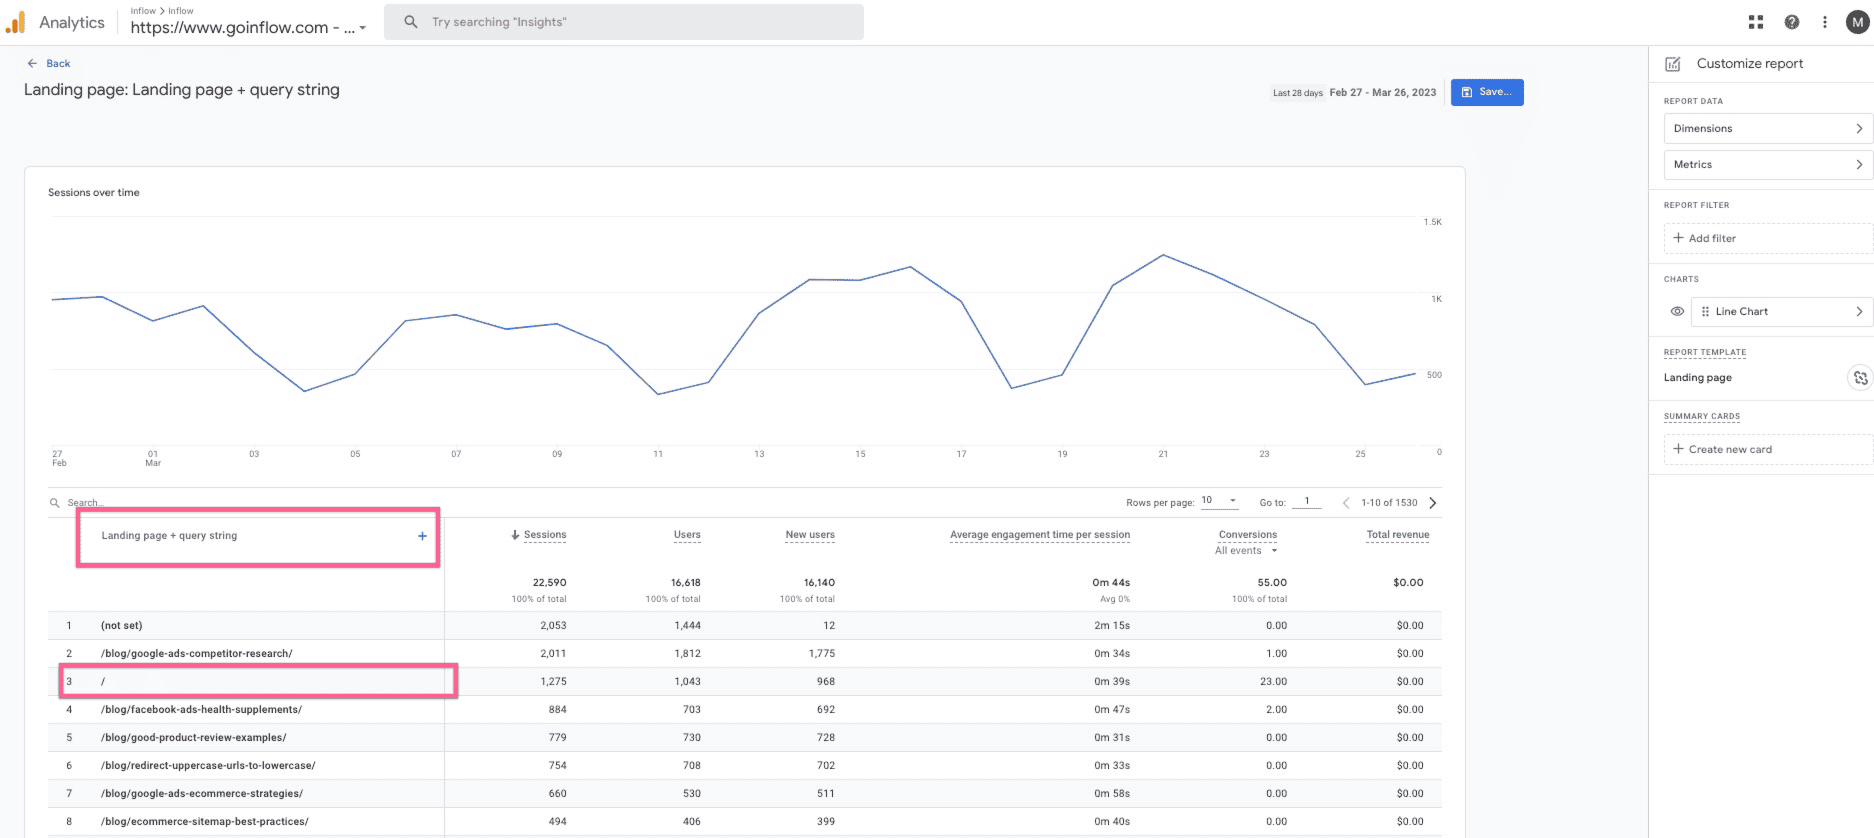
What you also may see is the number of sessions and things like that may change that goes with it, and that’s because there are other reasons that the landing page dimension might be blank. Those include, sometimes, when the landing page is not set. That’s when a user leaves a page open and then ends up starting a new session; there’s not really a landing page, if you will. And so, in that case, it would be “not set.”
But this is what most people are expecting to see, and so that is what we recommend doing here in the landing page report.
How to Analyze Your Product & Category Sales
Next, let’s look at analyzing some products and categories.
To do that, we’re going to stay in GA4, and we’re going to switch to the Google Analytics 4 Google merchandise store. This is a demo account. The data is not real, but it’s realistic, if you will, in most cases, though there are some issues that we find from time to time.
In here, what we’re going to do is go to the “monetization” section and then come down to “eCommerce purchases.” The default here will be “item name.”
What we can see here is all of the items that were viewed, how many times they were added to the cart, the purchases, the revenue that those generated, etc.
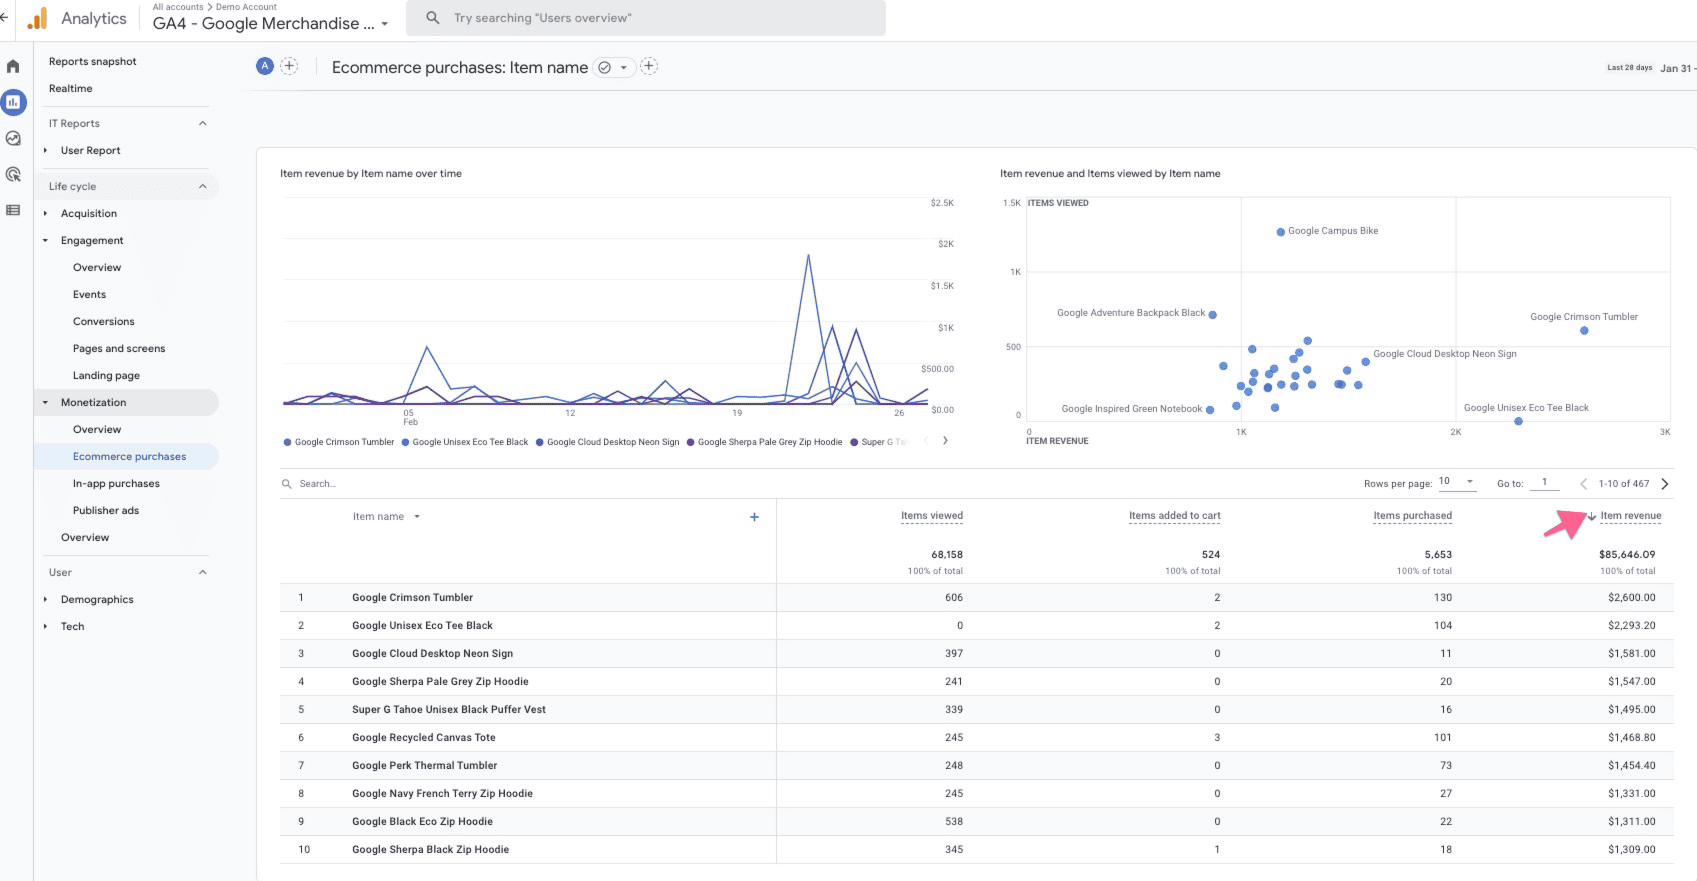
What isn’t always immediately obvious is how to sort, and you kind of have to roll over and get this little arrow to show up, and then you can click that.
Now, we’ve got it sorted by revenue, descending. And we can see here that today’s best seller, or at least for this time period, is the Google Perk Thermal Tumbler, and that generated $3,700 in revenue.
You can also use this to analyze categories. Same thing here: You can look at what your best-selling categories are on the site.
You can also, of course, flip this, look at what the most underperforming categories and items are, start to look at some other metrics and customizing these reports, and figuring out how to best optimize your eCommerce store.
How to Identify Channels Making You the Most Money
Next, we’re going to take a look at the channel reporting. This is another popular one; everyone wants to know what channels are sending the most traffic.
I will point out this report does have thresholding applied; we do not have the ability in the demo store to change the reporting identity. So, just keep that in mind as we’re looking at this.
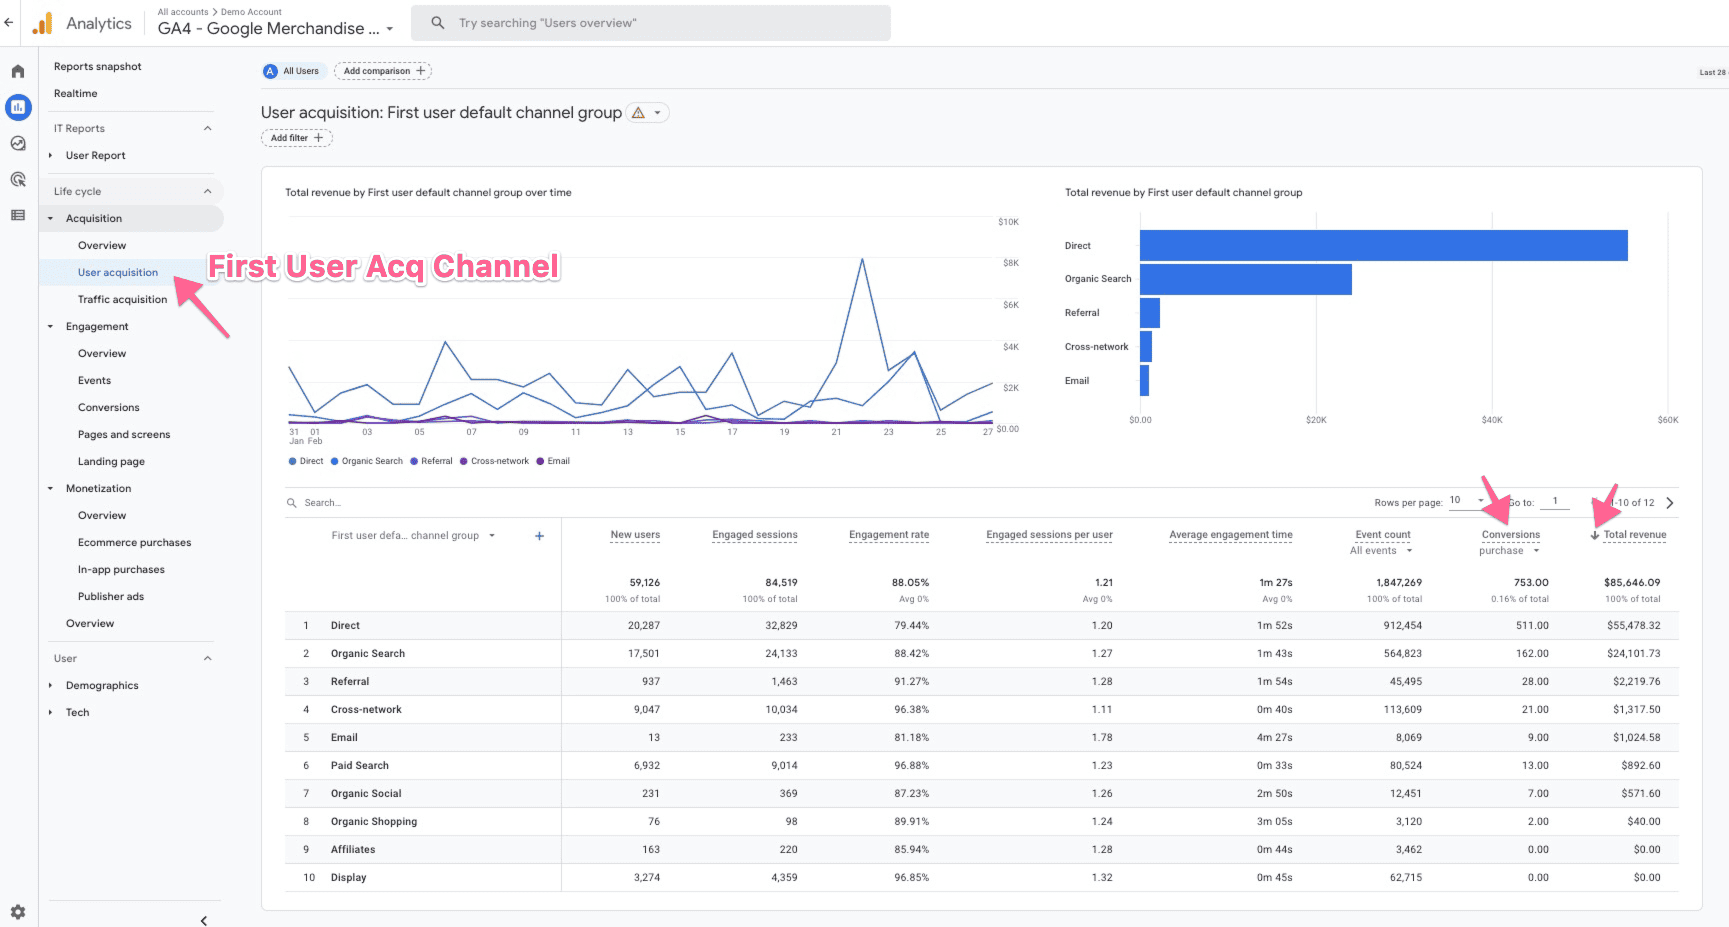
To get here, this was under “acquisition” and “traffic acquisition.” And what we’re really looking at here is a report based on sessions. And it’s important to keep that in mind, because in a minute, we’ll look at it based on sessions, as well.
This report, as you can see, is built using the “session default channel group.” If you do build your custom channel groups and things like that, keep that in mind that that’s what this one is based on, right. In addition, the attribution is going to be the default attribution model here, not necessarily the one that you choose.
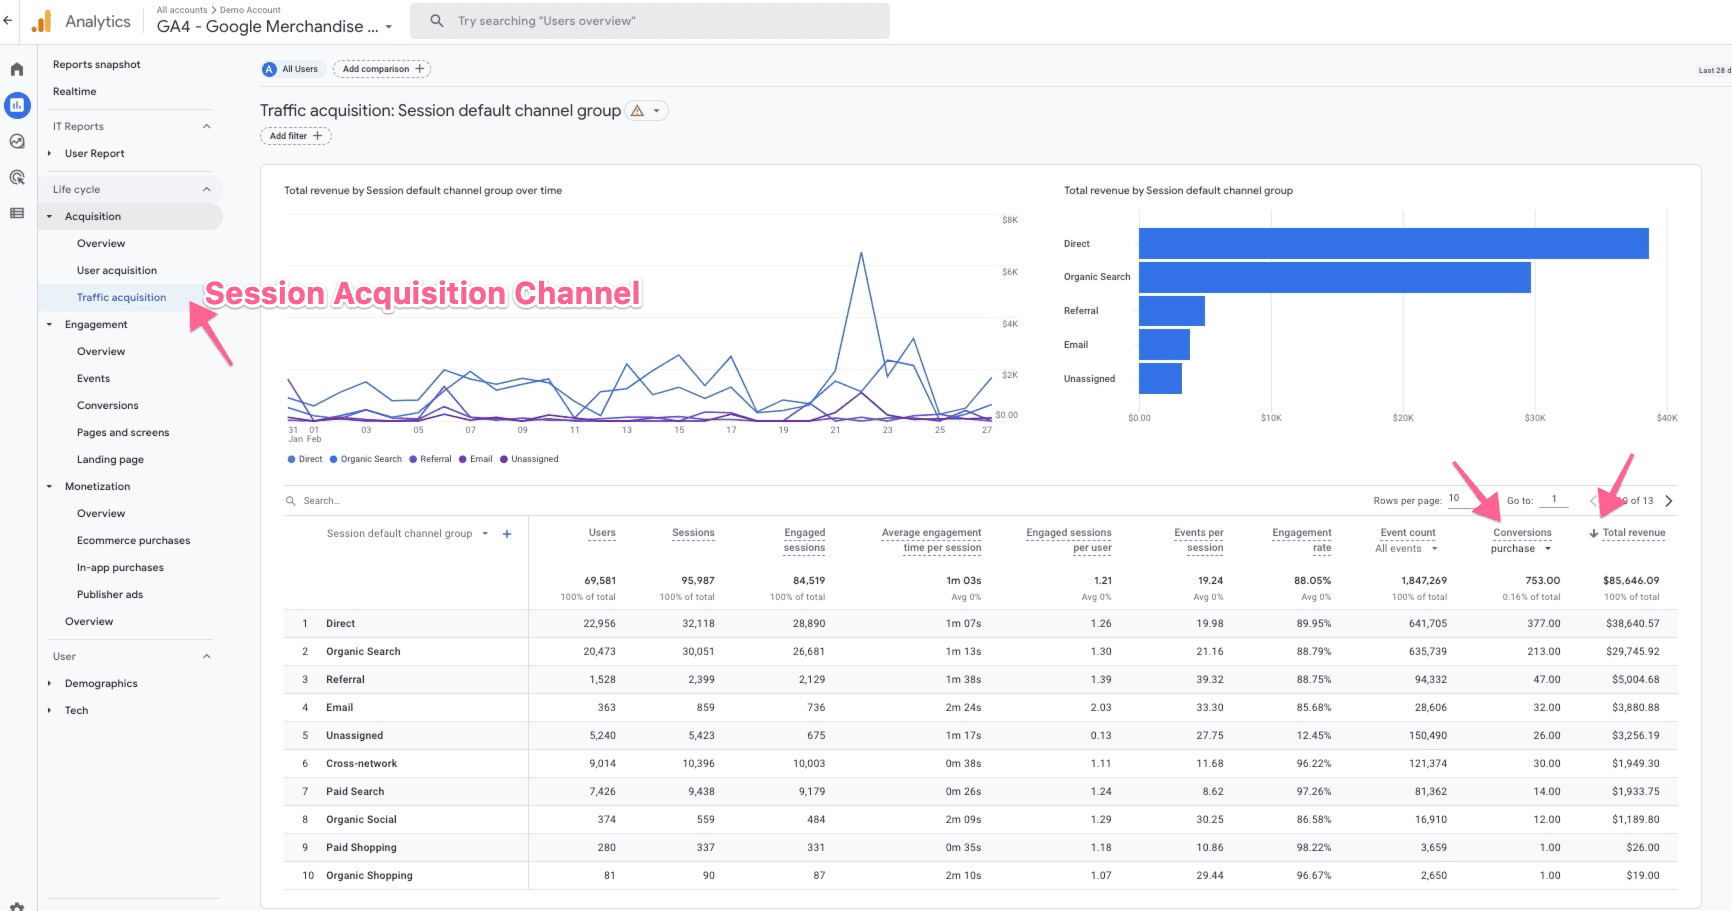
If you go into the user acquisition report, you’re going to see “first user default channel group.” And so that’s going to be based on the first click of the user.
So, even if they came to your site multiple times, they came from multiple devices, for the purposes of this report, it’s going to be based on what channel they came in on their first time as a user on your website.
Next is conversion paths and model comparison.
Google kind of switched places on us where it shows up. There’s this sort of newer section here called “advertising.” And, under advertising, we can do conversion path analysis, just like we were used to in Universal Analytics.
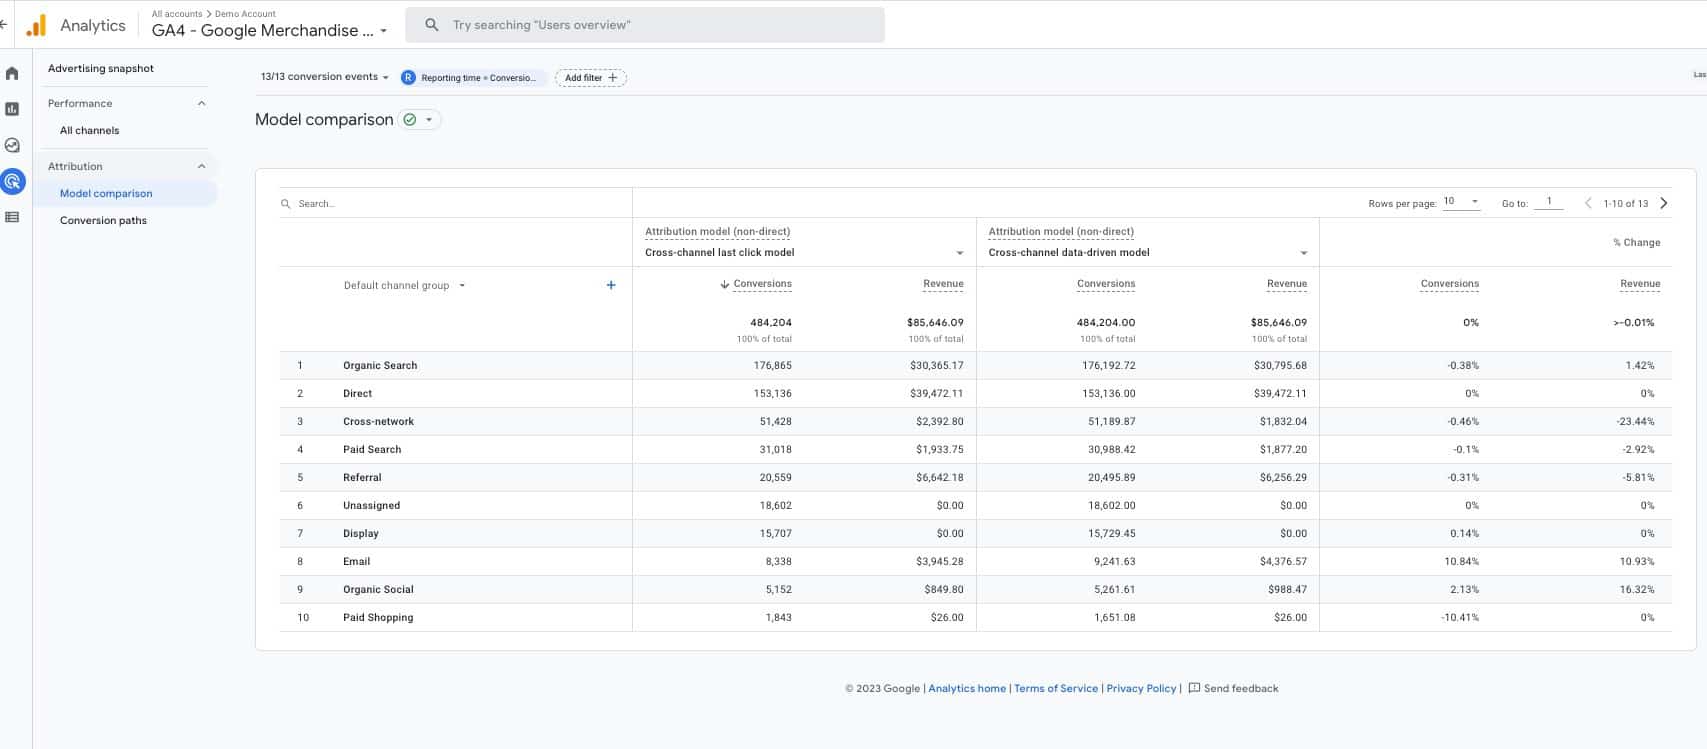
We can also do model comparisons. You can see here, comparing the “cross-channel, last click model” with the “cross-channel, data-driven model,” and see how those metrics stack up against each other.
That’s another place that you can see some of this channel reporting — and again, keeping in mind, the attribution is going to be based on whichever model that you choose in these sections.
How to Build an eCommerce Funnel Report
Next, we’re going to look at eCommerce funnel reporting.
Now we’re in the exploration report. If you click on “explore,” and you choose to do a funnel exploration, you will get sent into a screen that looks somewhat like this that you can customize.
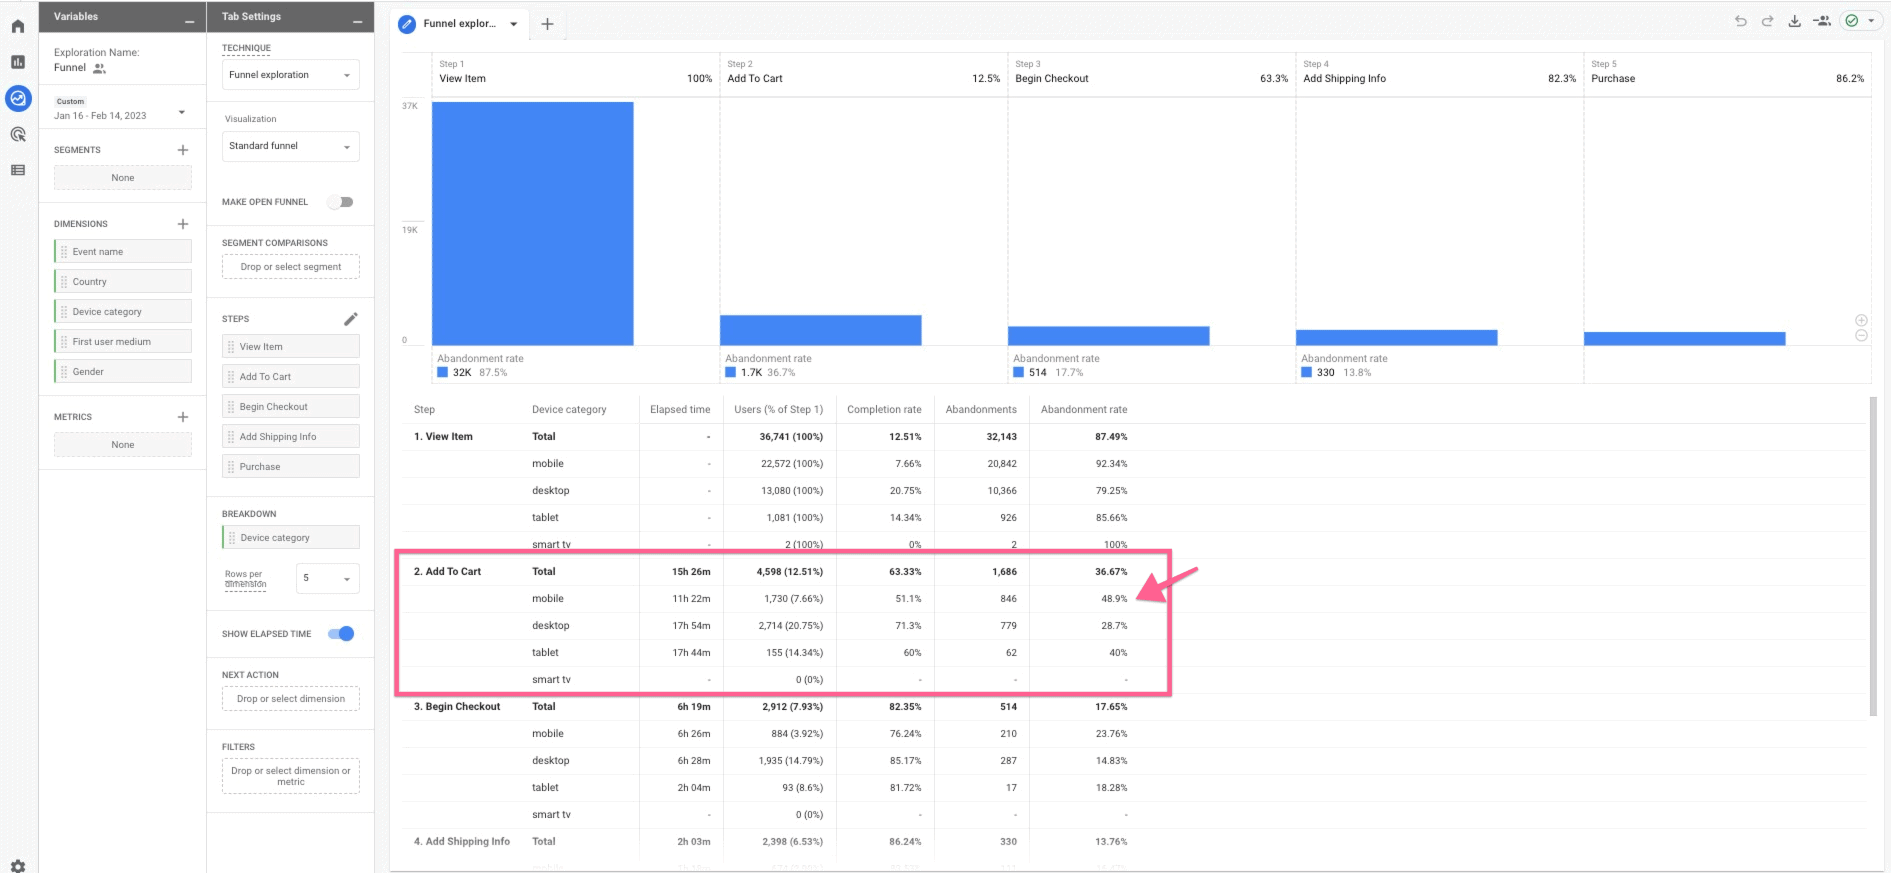
What I’ve done here is created a custom funnel. That’s the really cool thing about funnel analysis in GA4 versus UA.
In UA, you had to establish the funnel, it was very rigid, if you will. In GA4, you can come in and create a funnel at any time, you can look at data from the past, you don’t have to have it set up before you start analyzing data. There’s a lot of other things that you can do.
What you would do is define your steps here that happen. Of course, Google’s giving you the visualization that happens.
You can also look at this as a trended funnel versus a standard funnel, or make this an open funnel versus what’s now a closed funnel. That simply means that, instead of the user having to enter always at step one, in an open funnel, a user can enter it any step and then continue through the process.
How to Identify the Most Popular Conversion Paths
Lastly, we’re going to look at pathing.
I think this is one of the coolest things in GA4 — where we could look at user paths before, but now we can do reverse pathings.
What I’ve done here is I’ve started with my endpoint purchase event that happens in GA4, and then I’m tracing it back. I started with an event, but now I’m looking at the page path and screen class.
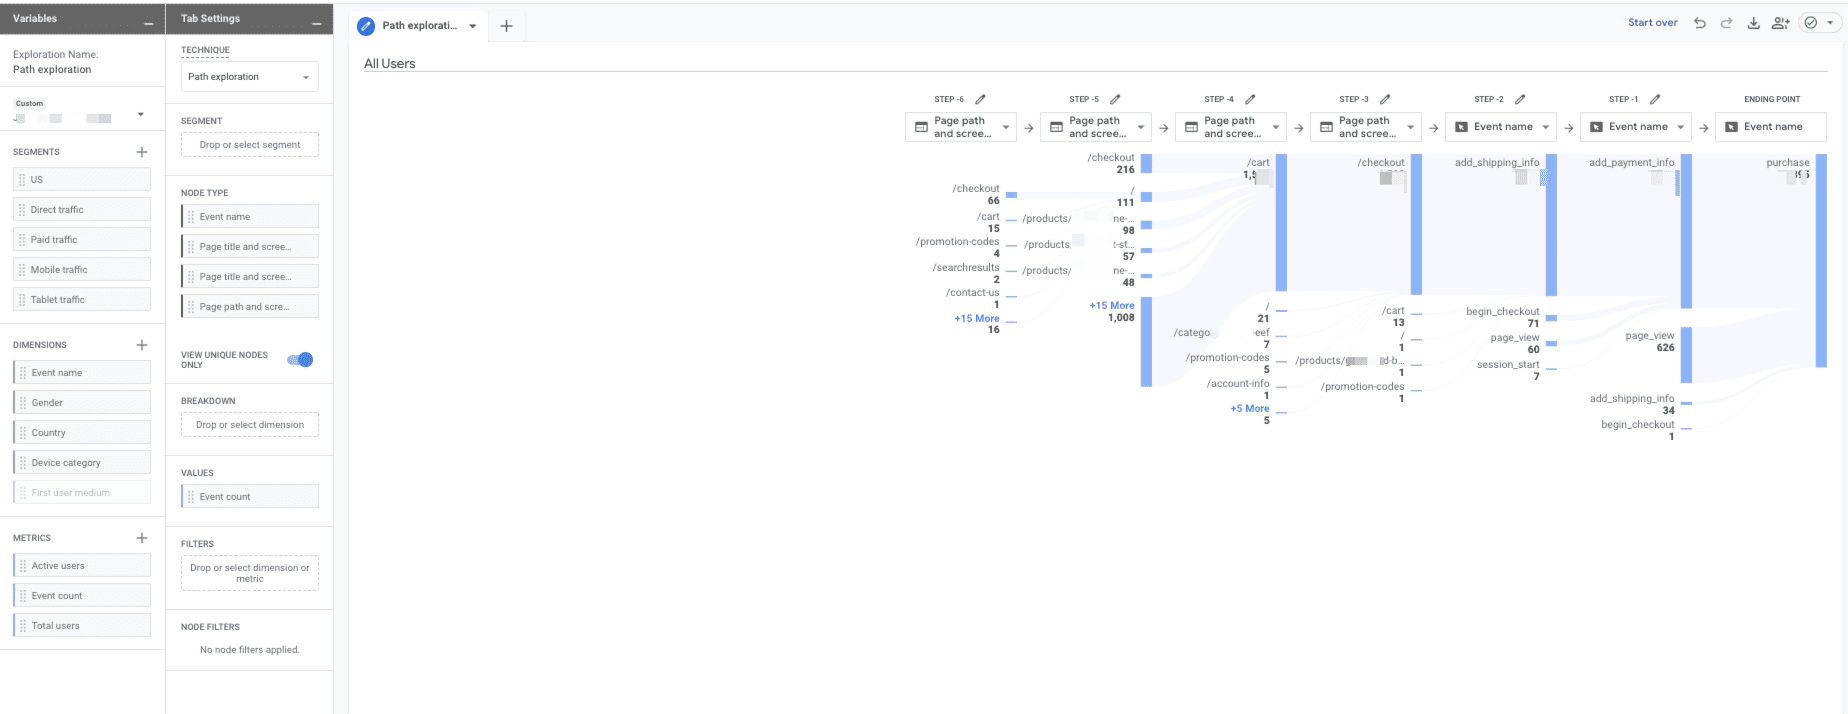
You can also change this to any of these options here — page title and screen name, page title and screen class — depending on how you want to see the user and how they made it, eventually, to the purchase.
This is just simply working your way backwards, and it can give you a real good idea of how users are getting there, what the path is that they’re taking to get to your ultimate goal. Of course, you can optimize from there.
So, that’s what I’ve got for you today in looking at the reports. I know we went through that really quickly, as well, and there’s a lot there.
Of course, if you have any questions, feel free to reach out to Inflow about how to set some of these up.
Hopefully now you know a little bit more about where to find your data and how to orient yourself in Google Analytics 4.
Your Team’s Next Steps
Kate Miller, Content Marketing Manager:
Awesome, thank you, Mike. Lots of helpful information, as you said — a lot to really digest and look through.
I would definitely recommend when this recording goes out tomorrow to take another look through and test it out on your own and see if you can recreate those reports. If you’re having issues or trouble, we are always happy to help and guide you through that process.
That takes us to our final section here, which is your next steps.
Now that we have all of this information about GA4, we have to figure out what to do with it — how we can move forward and make sure that your business understands how to use it in a way that works best for you.
So, essentially, there are two different paths here that we’d recommend based on where your business is at right now.
Still Need to Migrate to GA4?
First off, if you haven’t migrated to Google Analytics 4 yet, that is something you need to get on ASAP.
As mentioned, the deadline for Universal Analytics to shut off is this July, which is really only a couple of months away. It does take some time to properly and efficiently get your GA4 set up, so we would recommend reaching out to an agency like Inflow to get that started.
We’re happy to provide free migration proposals based on your particular needs and your site setup.
Already Migrated to GA4?
If you have already migrated to Google Analytics 4 — either working with Inflow or you had your development team do it or you had another agency work through it — we would still recommend that you consider an audit by a third party such as Inflow.
In Universal Analytics, 80% of the platform and how it works was just putting a snippet on your site, and 20% of that was going in and customizing it and making it work for you. Pretty easy.
GA4 is the opposite of that, where only about 20% of it is putting the code on your site. The other 80% does involve that customization and building those reports and integrations. So, in that situation, there’s really no one-size-fits-all approach.
If your professional or your dev team just went in and did the basics, you’re really not going to have the information in the setup that you need to efficiently track and report out of that platform. So, as mentioned, we do recommend getting it audited by a third party.
Once you’ve done that, or you’re comfortable with your setup, we also recommend working with someone like Inflow for a reporting plan — because as mentioned, Google Analytics 4 is not incredibly intuitive.
Having someone who’s an expert who can walk you through those different reports and help you build out those reports to make sure you’re seeing what you need on a day-to-day reporting basis and what is helpful for your business (which again, will be very different from company to company) — having all of that set up is going to be integral to your success moving forward on this platform.
Webinar Q&A
That all said, we have reached our last section here: our Q&A.
We’ve gathered a couple questions that came through, and then we also had some FAQs that we frequently hear from clients or people interested in Google Analytics 4 — some things that pop up frequently when they’re interested in this platform and wanting to learn more.
Which GA4 certification is the best one?
The first one that came in was about which GA4 certification from Google is the best one.
I’ll pass that off to Julia; I think she has an opinion on that.
Julia Morris, SEO & Lead Analytics Specialist:
So, there’s really only one official GA4 certification from Google. That certification does include a number of resources; that’s really the only one that you can say you are GA4 certified.
However, there are a number of other companies out there that maybe — while they haven’t quite developed a full course yet, since GA4 is always changing — have some really, really good resources, blogs, thoughts out there.
What’s the difference between user conversion rate and session conversion rate? Which is best for eCommerce businesses?
Kate Miller, Content Marketing Manager:
Something that I know comes up a lot with clients and people who are new to Google Analytics in comparison to Universal Analytics is the difference between user conversion rate, session conversion rate, how one is the default.
Can you explain which one, from your expert opinion, you think is best? And which one you would recommend for eCommerce businesses?
Mike Belasco, CEO & Founder:
Short answer is “It depends.” Every digital marketer’s favorite answer — but no, it really does.
I think that there are a lot of compelling reasons, and it’s really cool to have as much user data available as we have. And I think, as people start trusting that data more and using it more, it’s going to provide some really valuable insights, like having user lifetime value and different things like that, looking at those first user channels that bring people to the site.
And session conversion rate is what we’ve all been using. That was sort of the standard in Universal Analytics, and we didn’t have a lot of other great options. Even when Google added user reports to Universal Analytics, it left a lot to be desired.
It does depend on what you’re trying to do, but I think valuable data can be pulled from both.
What happens to Universal Analytics after July 1, 2023?
Kate Miller, Content Marketing Manager:
One quick question from Kelsie came in, as far as clarifying what Universal Analytics is going to do after July 1 — what happens?
Mike Belasco, CEO & Founder:
As far as we know right now, it’s just going to stop collecting data. It will still be up and available to look at your data and export reports and things like that. That will shut down in December of this year.
You’ll have about six months to look at your data and think about how, if any, you want to back up that data or archive it, export it, etc. But that’s kind of what we’re expecting from Google.
Jennifer Walsh, Google Agency Development Manager:
I just want to say Mike is 100% correct. It will stop receiving the data on July 1.
Julia Morris, SEO & Lead Analytics Specialist:
Jennifer, can you just clarify if that applies to all UA properties or just the free ones?
Jennifer Walsh, Google Agency Development Manager:
That applies to just the free ones. There’s a separate date for our paid ones, and to be honest, I don’t have it off the top of my head. There is a distinction there. That’s a good point.
Is Google Analytics 4 more accurate when measuring mobile vs. tablet traffic?
Kate Miller, Content Marketing Manager:
We had another question come in from Aaron, wondering if GA4 is more accurate when it comes to measuring mobile versus tablet traffic in comparison to Universal Analytics.
Mike Belasco, CEO & Founder:
Not that I’m aware of. That’s a good question.
It would be probably better at, again, tracking those users that use multiple devices, including tablets and things like that, and stitching those user sessions together for the same user. But, to my knowledge, it’s not necessarily any more accurate.
And I would also guess that it might be tempered a little bit by just some of the privacy standards in GA4 that might negate any better accuracy in that metric, so it might be very similar in general.
There are some other cool things that we can talk about. Going back to some of that orienting topic, modelled data also shows up in GA4. If you’re doing a lot of instead, if you’re really handling your consent settings well from your user and things like that, there are ways to configure Google or GTM to actually send some data to Google Analytics 4, even if the user has opted out of analytics tracking.
That data they use to then model what they think probably happened or whatever on the site. That gets incorporated into some of your reporting, as well.
Something to be aware of, depending on how you have that set configuration set up.
How do views and filters work in Google Analytics 4?
Kate Miller, Content Marketing Manager:
As people get into Google Analytics 4 and start playing around, being used to Universal Analytics, something that I think may come up is filters and views. A lot of people are used to seeing views in Universal Analytics. How does that translate to GA4, if at all?
Julia Morris, SEO & Lead Analytics Specialist:
Filters are significantly more limited in GA4 than they were in UA. Currently, GA4 only recognizes two filters: internal traffic and developer traffic.
There are ways that you can do some testing. However, once those filters are applied, that change is permanent. So, it’s significantly more restricted.
GA4 does do some automatic filtering of some spam. But you’re not going to have all of the filters that you are able to have in Universal Analytics, which very much ties into creation of different views.
Mike Belasco, CEO & Founder:
Views are built on filters in Universal Analytics, and, as Julia just said, we really don’t have those available to us like we did.
The way that we’ve been working with clients on that is by applying report filtering. Of course, it’s still called a filter. But, essentially, we’re filtering those reports.
Just like when we were looking at that landing page example, and we were doing a little bit of customizing of that report, we could have also added a filter — like, let’s say we wanted to make that report only for organic traffic. And maybe you had a filter in Universal Analytics that just reported on organic traffic; we could apply that, save that report, and also modify the user interface.
So, we actually have that report permanently showing up as a new link in that lefthand interface.
That is another cool thing about GA4: Yes, you’re not getting what you probably expected to out of the box when you look at that information. However, once you customize it and get what you want to see there, it can really make your job digging in and finding your data a lot more efficient.
What is your expert opinion on Google Analytics 4 as a platform?
Kate Miller, Content Marketing Manager:
We’ll end this out with one final question to our experts here. Having spent all this time in GA4 and working in it and understanding it more, I would just be curious in your top-level opinion of the platform and how you think it’s going to be helpful or conducive to eCommerce businesses moving forward.
Mike Belasco, CEO & Founder:
In general, I’m very excited and optimistic about the platform. As we’ve seen, there’s some really cool features.
I think folks that are serious about analyzing their data are going to get a lot of great use out of the explorations report and having data available in BigQuery to do some raw data analysis and other things — process that the way you want to process it, etc.
On the other hand, this has been a bit rushed, even with all the notice that Google provided. There’s still a lot of features that aren’t there; there’s still a lot of quirks and bugs that Google is working through. I think that’s a big part of probably why they extended the deadline for paying customers, so they could kind of learn from the non-paying customers.
But, overall, I think it holds a lot of promise. Google had to do it to keep up with privacy concerns that are everywhere around the world. It could be a better tool; it will be a better tool. But it’s still a bit of a challenge.
Everyone’s on a learning curve here. I guess the only reassuring thing I can say is we’re all in this boat together.
Julia Morris, SEO & Lead Analytics Specialist:
I would echo a lot of what Mike just said; I think GA4 has so much potential. I think what Jennifer shared is only scratching the surface of what we are going to see other people do. And I’m very excited to see that.
I’m really excited for some of the new metrics; I think, like, engagement rate is going to be such a cool metric to talk about with our clients.
However, as Mike mentioned, GA4 is changing quite literally every day. It’s constantly improving. It’s constantly growing. And it’s really not intuitive.
I continuously find myself trying to go where I used to go into UA, and that’s not an option, that report doesn’t exist, I need to build it. And that learning curve, I think, is going to be a huge challenge for everyone in the digital marketing industry or anyone who really interacts with anyone in digital marketing.
But again, the potential — so exciting. Just about every week, it seems, Google rolls out new metrics, new item parameters, custom channel groupings. All of that just continuously improves and rolls out, so excited to see where we end up.
Kate Miller, Content Marketing Manager:
Absolutely. I definitely agree with both of you. And that’s a great thing to say about how there is a learning curve involved.
And that is why we are recommending — whether or not you’ve already migrated or you migrated and you haven’t looked into your reports — is to start looking at it now.
Hopefully, this webinar was helpful for everybody in understanding a little bit more about the platform and helping set that foundation for you to get in and start testing and playing around with it and seeing what you can do for your business.
A great presentation: Thank you so much to Julia, to Mike and to Jennifer, for all of your thoughts and insights. We really appreciate it.
And, again, I hope this webinar was helpful to all of you, our guests.
You can feel free to reach out to our team with any questions or requests you may have. We’re happy to help point you in the right direction and help provide the information that you need to be successful as we all embrace and learn to love Google Analytics 4.


