We’re all now, officially, in the age of Google Analytics 4. Whether you embraced the platform change with open arms or were dragged kicking and screaming into the new era, today, it’s all about GA4.
Despite Google lauding its praises, GA4 isn’t always as clear as it seems. In fact, as you evaluate your current data and compare it to historical performance in Universal Analytics, things may not match up. Perhaps you’re seeing fewer sessions and users in your new GA4 reports, or maybe you’re missing proper revenue attribution in one platform or another.
What gives? Is Google screwing you over with its new analytics platform?
Here’s the truth: Your data inconsistencies probably aren’t a flaw in the system. They’re actually part of the design.
Today, we’ll walk you through what we mean.
Using our experience tracking data for 50+ websites over the last year, we’ll explain how GA4 and UA compare in terms of metrics and reporting. And, to make the comparison a little easier, we’ll offer a free, downloadable template for your reporting needs.
We’ll also touch on how GA4’s data models stack up against other platforms (including eCommerce ones) — and how you can take all of this into account to develop a nuanced understanding of your reporting moving forward.
Let’s get started.
The video below is hosted on YouTube. If you need assistance with viewing the video, please contact info@goinflow.com.
Universal Analytics vs. Google Analytics 4: Important Data Differences to Know
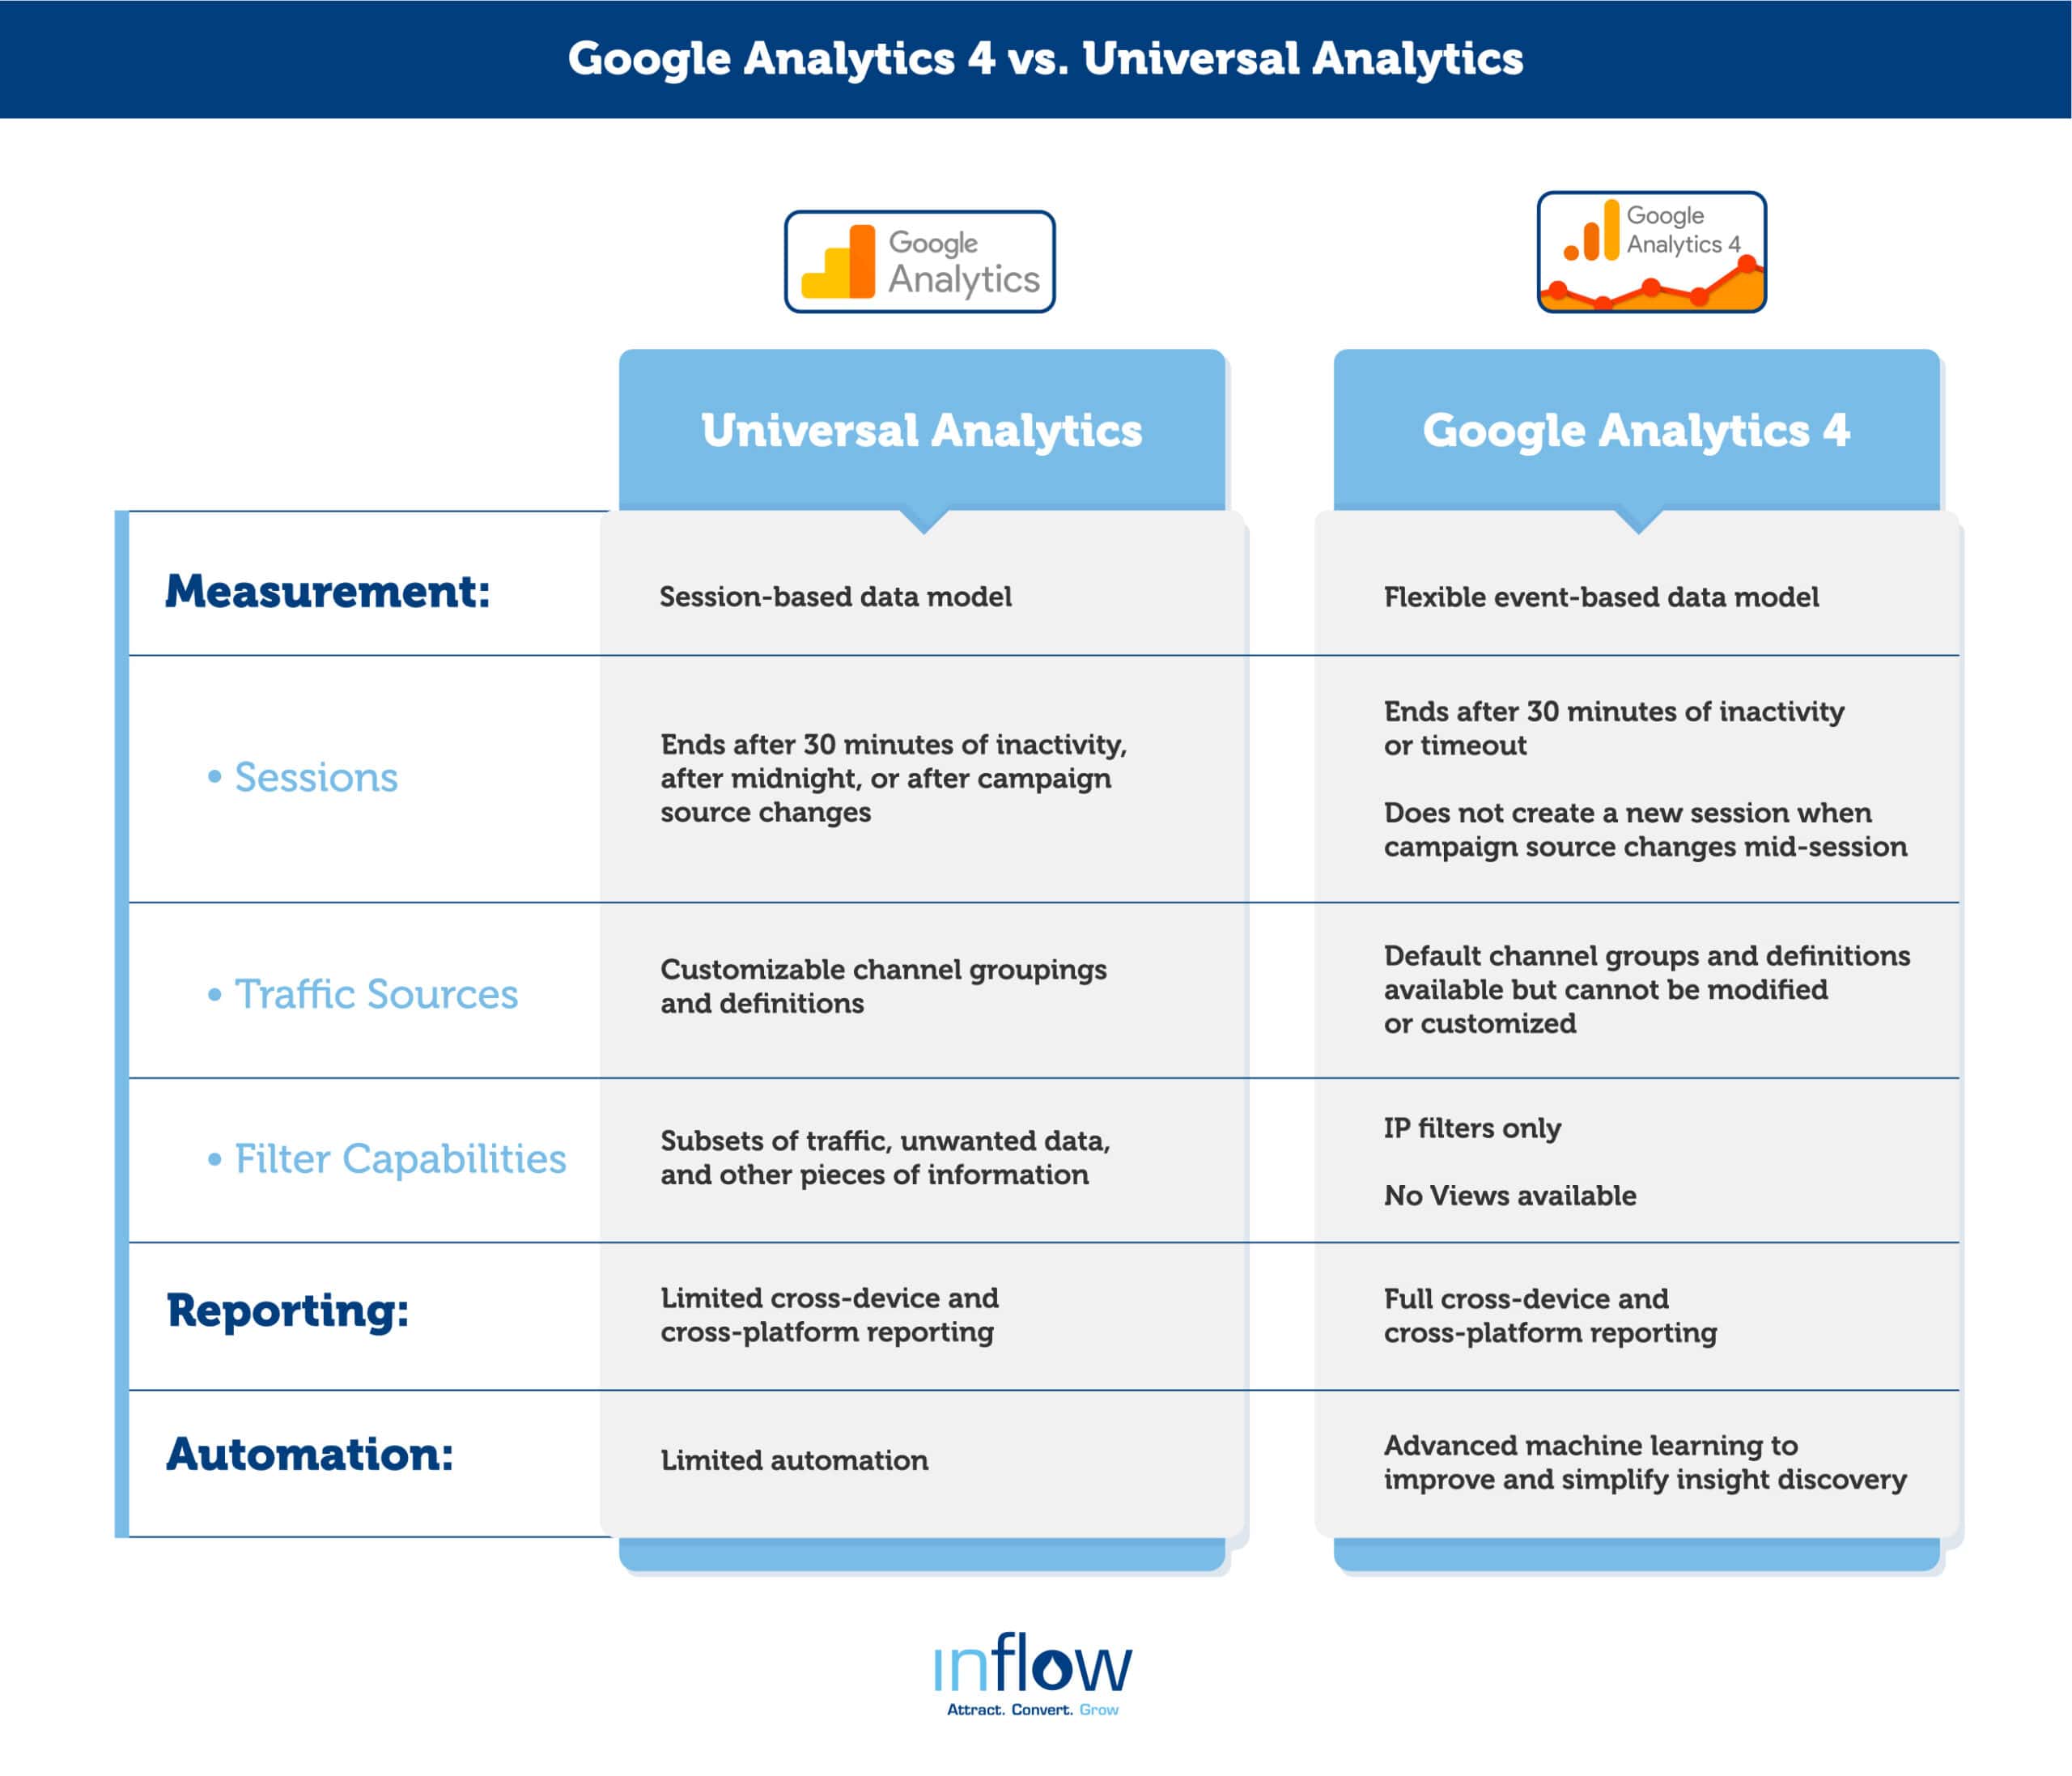
We’ve talked about it before, but it’s worth stating again: The biggest differences between Universal Analytics and Google Analytics 4 stem from the latter’s improvements in data tracking.
In the session-based Universal Analytics, website events (like sessions, users, etc.) were tracked as different “hit” types. With GA4, Google overhauled that process, instead tracking every hit type as an “event” in and of itself.
The result: An event-based data tracking system that looks and feels very different from Universal Analytics, requiring digital marketers across the globe to completely rethink their data collection strategy.
The video below is hosted on YouTube. If you need assistance with viewing the video, please contact info@goinflow.com.
So, how do those new features and changes in functionality affect what you’ll see in your reports, especially when comparing UA vs. GA4?
Below, we’ll discuss some of the most common metrics we’ve discussed with clients when it comes to inconsistencies in their Google Analytics 4 reporting.
For further reading, we recommend Google’s comprehensive guide, which compares every key difference in metrics across its two analytics platforms. You can also download our free GA4 vs. UA cheat sheet as a reference for your marketing team.
Now, let’s get into five big differences between UA and GA4 that your team should know:
1. Bounce Rate
First, let’s talk about a key metric in Google Analytics 4: bounce rate.
When we first transitioned our clients’ accounts in the spring of 2022, bounce rate didn’t exist in GA4. We anticipated it being added in later, and we were right: Bounce rate was added to the platform in early July.
But it’s not the bounce rate you’re used to in Universal Analytics.
Instead of the percentage of single-page sessions with no page interaction, the GA4 bounce rate is the percentage of sessions that were not engaged (i.e. lasting 10 seconds or longer, having at least one conversion event, or having at least two screen/page views).
In other words, it’s the inverse of your page engagement rate, a new metric that has no equal in UA.
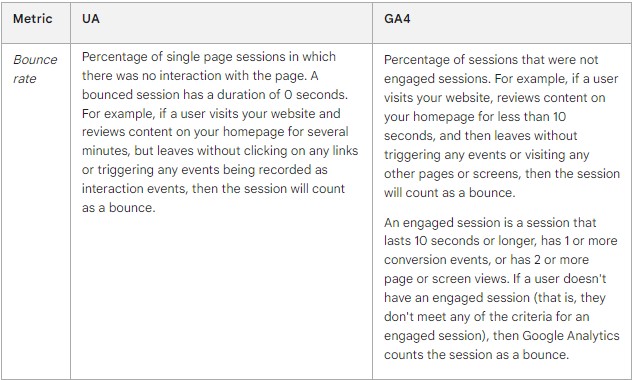
So, for example, if a user connects to your website, reads a blog for a few minutes without any other interactions, and then leaves, that no longer qualifies as a bounce. Compare that to UA, where even a full blog read could be counted as a bounce if no links were clicked or no other events were triggered by user interactions.
2. Sessions
Because of GA4’s switch in its approach to data tracking, sessions are also calculated differently than they were in Universal Analytics.
First, visitors must meet the “engagement” requirements detailed above to count as a “session.” Secondly, how long that engaged session lasts is based on different parameters than in UA — most crucially, that sessions are not restarted at midnight or when a new campaign source is encountered (both of which were qualifiers for a new session in Universal Analytics).
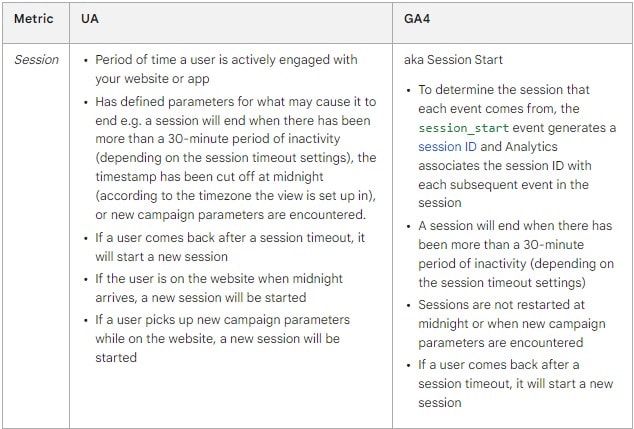
For this reason, your GA4 property may report a smaller number of sessions than your UA property, although they’ll likely be generally comparable.
3. Users
Similarly to sessions, you can usually expect to see fewer users reported in your Google Analytics 4 tracking. This is due to the platform’s arguably biggest improvement: its ability to track users across devices as one, rather than create new users as they switched devices (as Universal Analytics did).
Don’t panic about this discrepancy in number of users between GA4 and UA. Instead, celebrate it as a more accurate, streamlined version of cross-device user tracking, eliminating any double-counting.
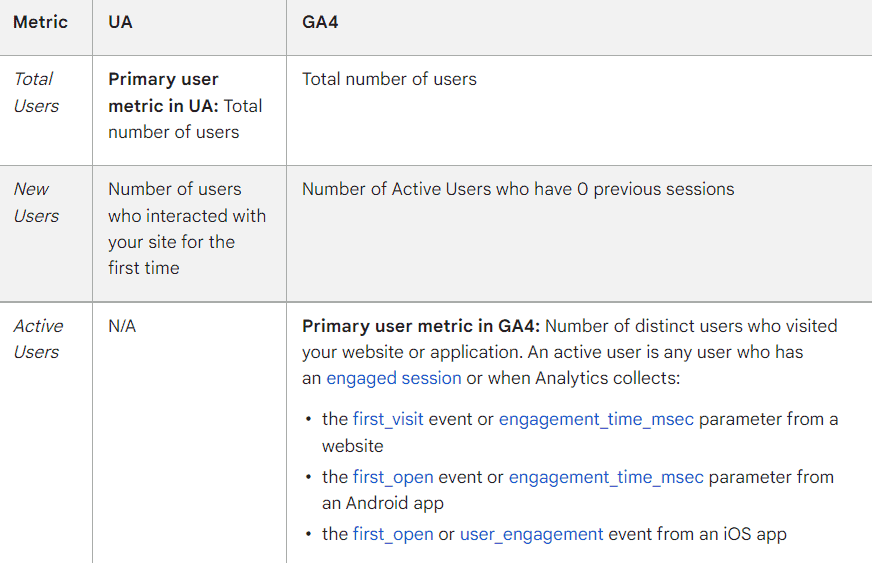
Like in UA, GA4 tracks three different “categories” of users. While most of the metric descriptors remain the same, note that GA4’s primary user metric is “Active Users,” compared to UA’s “Total Users.”
Thus, make sure to update your reporting accordingly.
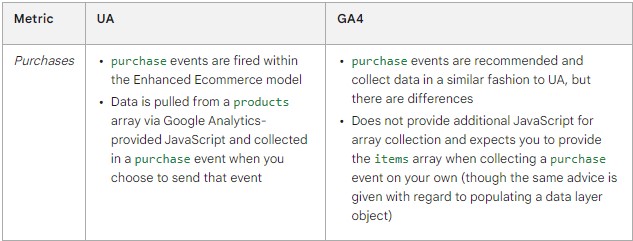
4. Purchases
eCommerce transactions one of the few metrics that should compare closely across Universal Analytics and Google Analytics 4, because the “purchase events” are tracked almost exactly the same across both platforms.
As Google itself states, “We never expect all events to be collected perfectly… However, these events are atomic and critical, so event counts should match closely across UA/GA4.”
Any small differences you do see can be because of changes in time zone settings or filters on your UA profile, and they tend to be less visible when viewing longer time periods (like months instead of days). In addition, if you made large changes to your website when setting up GA4 events, UA and GA4 may not line up.
However, like UA, GA4 will likely not count some purchases.
5. Goals/Conversions
Finally, let’s talk about the more “customizable” metrics available in Google Analytics 4: conversions.
Previously tracked as “goals” in Universal Analytics, most GA4 conversion events must be specified by your analytics team (except for certain automatically collected events, which are tracked via Enhanced Measurement and other default settings).
Typically, these custom events include non-purchase activities like “Form Submit,” “Email Submit,” “Save for Later,” etc.
In yet another contrast with UA, Google Analytics 4 can track multiple conversions for the same event per session.
For example, if a user were to submit multiple contact forms in one session, the Universal Analytics goal would fire once. In GA4, the platform will track multiple conversions from those multiple submissions — a feature that has caused more than one headache for our clients.
It’s worth noting that you can now change this feature in GA4, but it may not make sense in your circumstances. And, because this option wasn’t always available, your historical data will have recorded the multiple conversions.
The video below is hosted on YouTube. If you need assistance with viewing the video, please contact info@goinflow.com.
Because of GA4’s limited approach to conversions (i.e. using one “event” rather than several hit types), you may not be able to exactly duplicate your UA goals in the new platform.
If you’re struggling to replicate your Universal Analytics properties in GA4, we recommend working with a Google Tag Manager (GTM) expert to set up and configure your event tracking.
Comparing These Data Points With Inflow’s Dashboard
If you were on top of your GA4 account configuration last year, you’re lucky enough to have data on both platforms tracking simultaneously. And, while UA stopped tracking data on July 1, 2023, you’ll still have historical data in the bank that allows you to more easily compare GA4 vs. UA (and vice versa) to get a more accurate understanding of your website performance.
To aid you in that historical analysis, we’ve created a free, downloadable Google Analytics Comparison Dashboard.
Within it, you’ll find a simple plug-and-play template, where you can track and compare your data from both Google Analytics properties. With this side-by-side approach, you can better analyze your metrics and create a more effective marketing strategy moving forward.
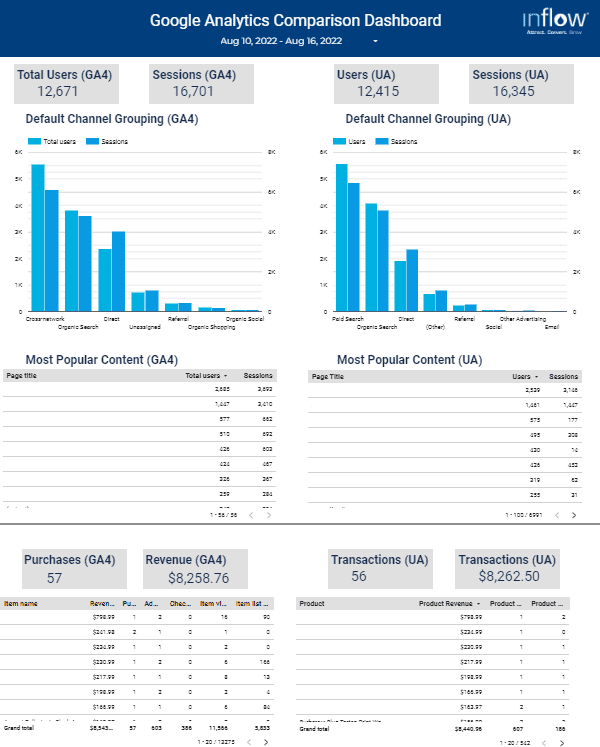
Note that direct comparisons of UA and GA4 data are only possible through time frames up to last July. However, you can still use this template to compare historical data from UA to your GA4 data, which can be useful for comparing seasonal website performance. (You’ll need an external data stream like BigQuery to host anything beyond GA4’s default data retention limits.)
Download your copy for free by filling out the form below.
Download Our Google Analytics
Comparison Dashboard now.
Don’t Forget Your eCommerce Platform
As you’re reviewing how your data compares in Universal Analytics vs. GA4, don’t forget to keep other reporting platforms in mind, too — particularly, your eCommerce platform.
Most website hosting software provide their own in-platform reporting, especially those serving eCommerce businesses. While this can be another helpful resource for understanding your performance, use the tools with a grain of salt, because they’ll often report different numbers than Google Analytics 4.
The video below is hosted on YouTube. If you need assistance with viewing the video, please contact info@goinflow.com.
As an example, let’s look at Shopify.
Unfortunately, Shopify will never match up perfectly with the data you receive from Google Analytics 4, a situation we’ve seen frequently among our eCommerce clients. There are a few reasons why:
- Shopify apps can interfere with GA4 eCommerce tracking. Many Shopify plugins and applications allow for ease in setting up site events like email subscriptions, upsells, cross-sells, checkouts, and add-to-carts. However, they frequently impact our ability to collect data in GA4. While we’ve found a few solutions, some eCommerce sites can only receive GA4 data on “view product” and “purchase” — nothing in between.
- Certain browser features can block GA4’s tracking. If your shoppers use ad blockers while browsing your site, some of their actions may be hidden from Google’s trackers. Similarly, if your site uses JavaScript, but your customers’ browsers don’t execute it properly, your web analytics data in GA4 may be inaccurate.
- Shopify tracks differently than GA4. Because the two platforms track events differently, there may be inconsistencies in subsequent data. For example, most basic Shopify stores will not register (or at least correctly register) checkout events like “begin_checkout,” “add_shipping_info,” etc.
Again, this variability is nothing to panic about. If your data discrepancy is anywhere between 10% and 12%, consider yourself in the “normal” range. (Here at Inflow, our clients have regularly stayed between a 1% and 10% discrepancy, with some being even closer than that!)
Once your Shopify and GA4 discrepancy levels surpass 15%, however, it’s time to bring in an expert for some problem-solving.
Use a Comprehensive Reporting Perspective
As your team starts using GA4 reporting, be prepared for these new data inconsistencies to emerge along the way.
You could have the wrong analytics setup, your customers might be using VPNs or not loading the web page entirely, or certain browser features (looking at you, Safari) may be messing with your analytics tracking. Whatever the issues are, by identifying them now, you’ll have plenty of time to find a solution and reconcile any differences moving forward.
Remember: Our Google Analytics Comparison Dashboard can help you track this data all in one place for ease of analysis. But, if you need more advanced help in configuring your Google Analytics 4 tracking, our team is happy to create a custom proposal for your needs.
In the meantime, review our other Google Analytics 4 resources below to better inform your DIY process:


0 Comments