While default properties and reports in Google Analytics 4 have some nice features, for most businesses, they lack some significant functionalities — namely, the ability to compare more than two time periods at once.
That’s not even mentioning the marketing campaign datasets you’re tracking outside of GA4. Combining that data with GA4 reports can be a huge headache (not to mention incredibly time-consuming) for even the most experienced strategists.
But, without that full picture, your business lacks important insights into overall performance.
Enter Inflow’s solution: Our free Google Sheets KPI Dashboard.
Below, you’ll learn how to quickly create a dashboard that contains metrics for overall, organic, and paid traffic, with customizable sections to add any other data you’d like.
As a bonus, I’ll show you how to combine reports for multiple sites into one centralized, dynamic dashboard.
Let’s get started.
Introducing: The New-and-Improved KPI Dashboard
For those who downloaded this tool pre-2024, you’ll likely notice a few changes in our new version.
First, we’ve updated the template to allow for data pulls from the new Google Analytics 4 (in contrast to Universal Analytics, which was sunset in July of 2023).
We’ve also dropped the “eCommerce” from the title. Why? While the example spreadsheet includes crucial eComm data points like purchases, it can be easily changed to reflect key performance indicators for lead-gen and other businesses, as well.
The result: A widely applicable template that helps marketers in any industry better understand their site’s performance.
You’ll still need to use Supermetrics automation (paid subscription required) to create a fully functional version with your unique business KPIs in Google Sheets.
Once configured, the dashboard will automatically refresh in the time increments you specify, and you can easily import data from:
- Google Analytics
- Google Search Console
- Google Ads
- Moz
- Semrush
- Microsoft Ads
- Facebook Ads
- Adobe SiteCatalyst
- And many other sources
Download your copy of the Google Sheets dashboard template, make a copy, and follow the instructions below to start customizing it your site and data points.
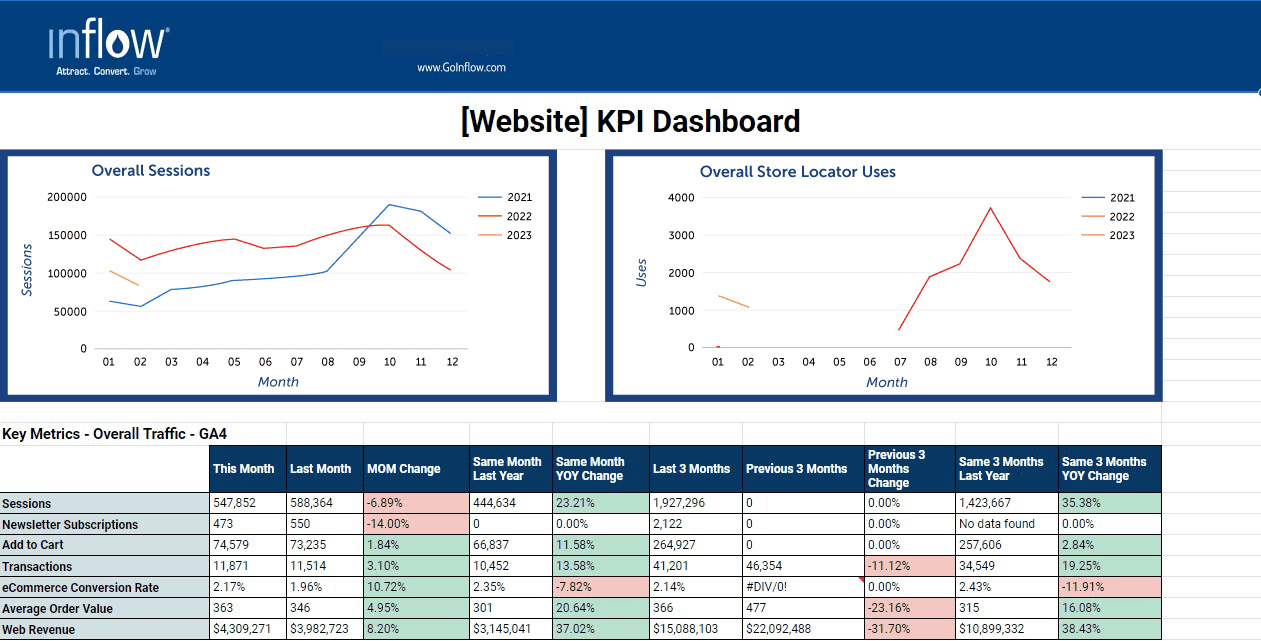
Exploring Inflow’s KPI Dashboard Template
Before we get into the nitty-gritty of building your dashboard, let’s “begin with the end in mind” per Stephen Covey, and review exactly what is in this dashboard.
We designed our KPI Dashboard Template to visualize a quick “health check” of site performance against various points in time. Any questions that arise from this report are often answered by diving deeper into your data source, whether it’s Google Analytics 4 or something else.
Our dashboard template assumes you care mostly about overall, organic, and paid traffic. However, there are opportunities to insert other significant KPIs for your business into this template.
The example above represents an eCommerce website with one other “significant” non-eCommerce goal, like downloading an important buying guide or registering for the email list. We’ve also pulled metrics from Google Analytics, Google Ads, and Moz in this screenshot.
As you can see, we’ve laid out this interactive dashboard to include three sections:
- Overall Traffic
- Organic Traffic
- Paid Traffic
Each section features a graph of traffic (sessions) and revenue month over month for the last two years.
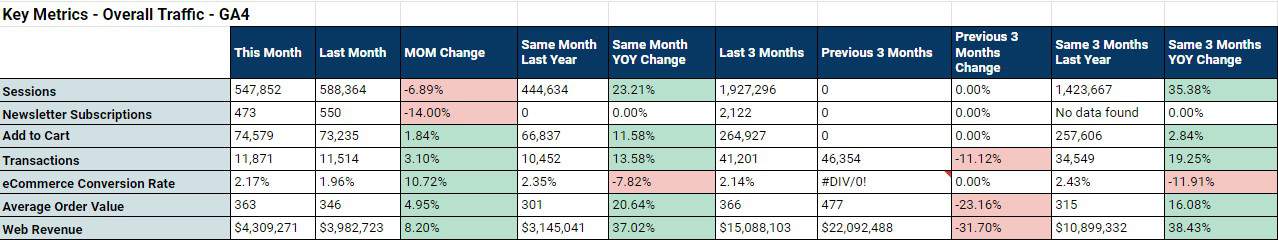
Here’s a close-up of the Overall Traffic section:
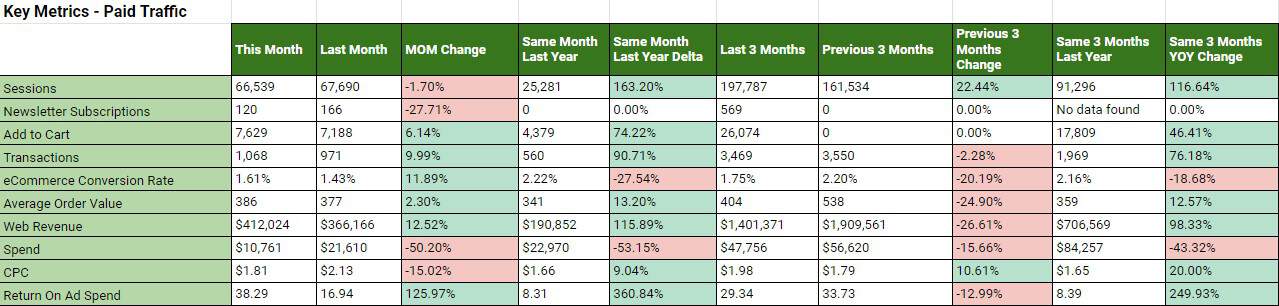
The Organic Traffic and Paid traffic sections look similar, except the Paid contains CPC and return on ad spend (ROAS), as well.
A further explanation of the columns in the report:
- This Month: The reporting month
- Last Month: The month before reporting month
- Same Month Last Year: The reporting month last year
- Last 3 Months: The reporting month plus the two months prior
- Previous 3 Months: The three months prior to the last three months
- Same 3 Months Last Year: The reporting month plus the two months prior, last year
How to Build Your Custom KPI Dashboard: Step-by-Step Guide
Now that we know what we’re building, let’s get started.
Step 1: Prepare Your Tools.
First, make sure to install the Supermetrics Google Sheets Add-on.
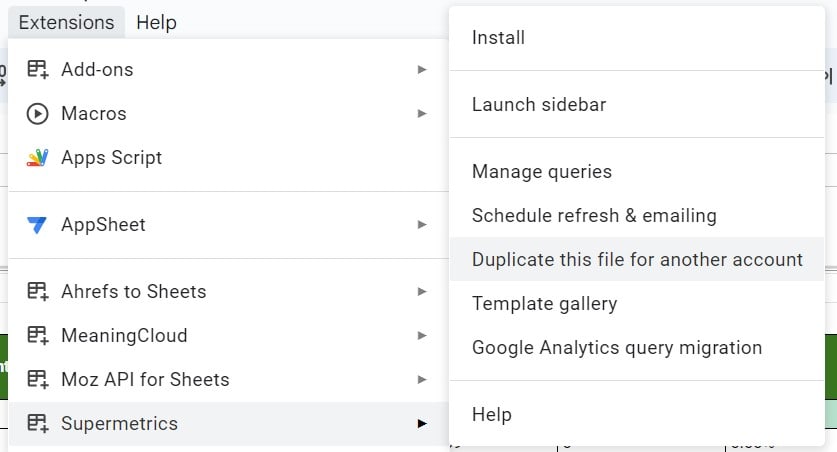
Next, open up your copy of the dashboard template and launch Supermetrics by clicking:
Extensions -> Add-Ons -> Supermetrics -> Launch Sidebar
Step 2: Add Your Data Sources.
Configure the Dashboard to use your Google Analytics 4 and Google Ads accounts by clicking:
Extensions -> Add-Ons - SuperMetrics -> Duplicate This File For Another Account
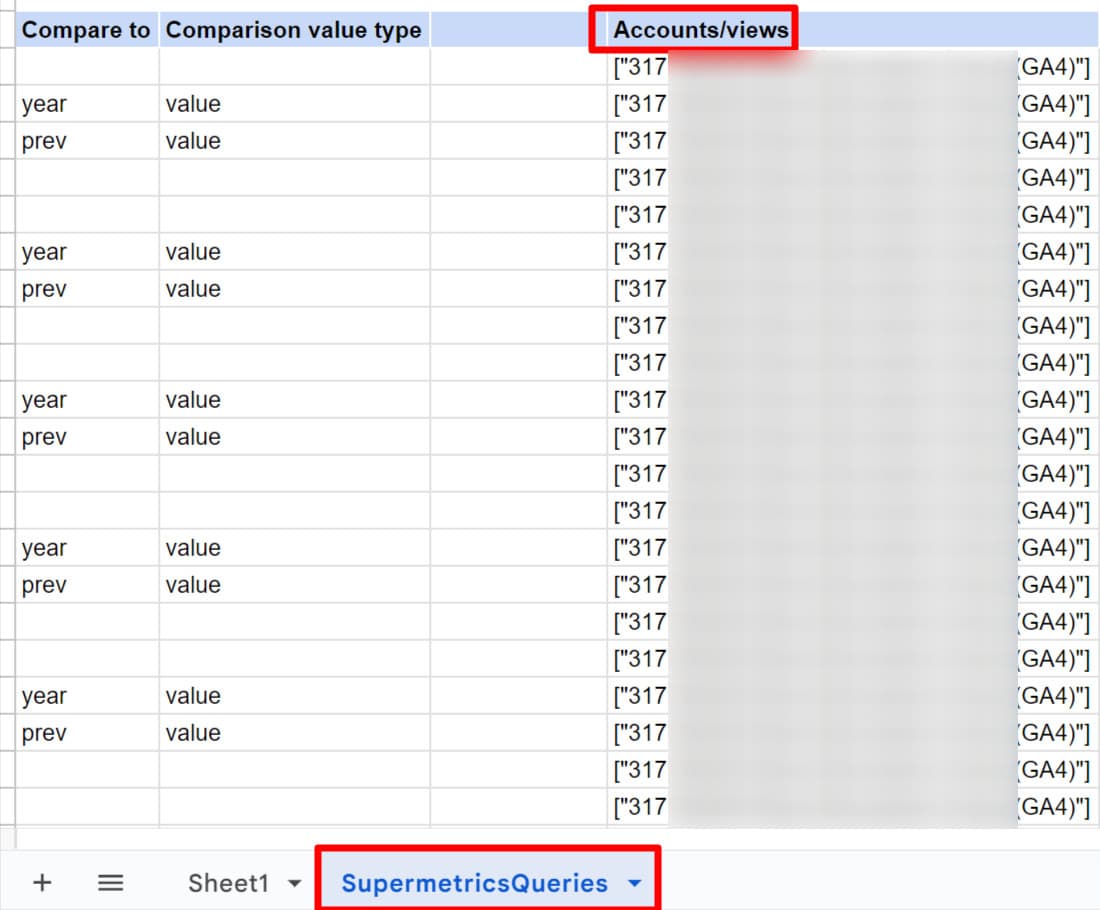
Once you’ve duplicated the file, you need to update the account IDs to pull from your own GA4 and Google Ad properties. Click on the sheet named “SupermetricsQueries,” and scroll to the column titled “Accounts/views.”
Change one of the queries to pull from the GA4 account(s) you own. Copy and paste the account number, and view across all relevant GA4 data pulls.
Repeat the process with your Google Ads account(s).
Step 3: Choose Your KPIs and Metrics.
You’ll get the most value out of our Google spreadsheet template by adjusting the included metrics to be appropriate for your website.
In other words, make sure you’re choosing the right goals for your reporting dashboard.
In our dashboard template, we’re pulling in events for newsletter signups. You can update this GA4 event to whichever specific event your business needs to track, such as add-to-carts, PDF downloads, specific pages visited, and more.
To do this, Search and Replace within the Supermetrics Queries tab.
SEARCH for: “eventName”,”operator”:”=@”,”value”:”newsletter
Replace it with the event name found in your GA4 account.
Step 4: Customize Your Report Tables.
If you’ve chosen new metrics and data points to track, you’ll need to customize your report tables by adding the proper labels on the leftmost column.
Note: Don’t delete rows; only delete values from the table, as this can affect the “inner workings” of Supermetrics.
You can shift around what data goes in which row, but just make sure it matches the query output from Supermetrics.
Step 5: Refresh All Queries.
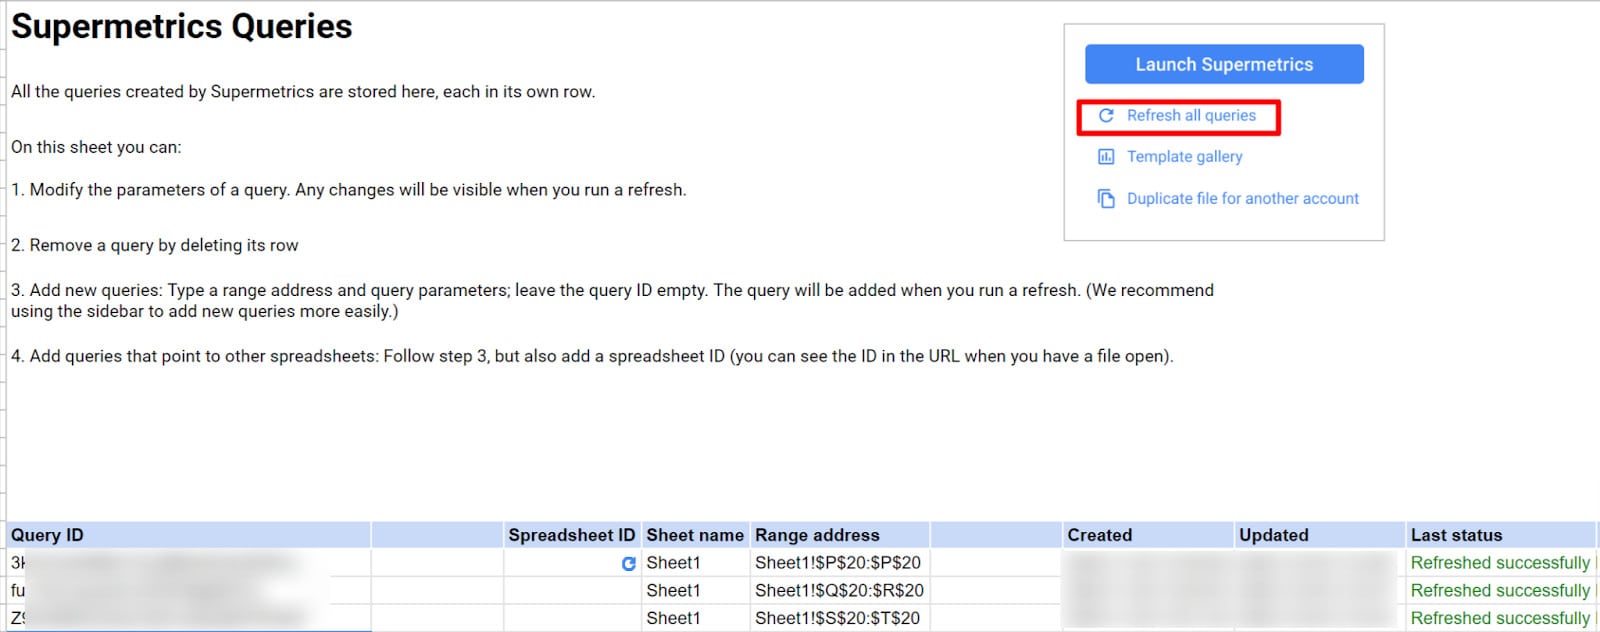
To ensure that all of your queries have executed without error, review the Status message on the Supermetrics Queries tab. (Hint: The tab may be hidden.)

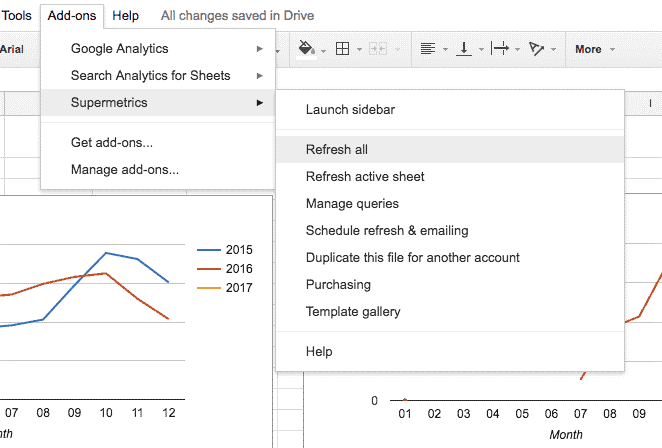
To force the Supermetrics queries to run, Extensions > Supermetrics > Refresh All.
Alternatively, you can click on the “Refresh All Queries” text at the top of the SupermetricsQueries sheet.
How to Enhance & Improve Your KPI Dashboard
Inflow’s free Google Sheets dashboard just barely scratches the surface of the reporting that can be done. How advanced you make your template is up to you.
Some ideas? Pull in additional eCommerce-specific key metrics (top products, Add to Cart conversion, steps in the checkout process, etc.) for a fuller picture of your customer behavior.
There’s also no limit to the data sources you can pull in with Supermetrics, so go wild with additional integrations such as Google Search Console, Semrush, Ahrefs, and more.
You can also incorporate Google Looker Studio (formerly known as Data Studio) for enhanced data visualization of your site’s performance with bar charts, pie charts, and other options.
If you need professional help to make that all happen, reach out to our analytics experts today. Our team members can help you build a comprehensive reporting strategy for 2024 that uses GA4 and other sources to paint the fullest picture of your business’s performance.
In the meantime, download our free marketing dashboard below:


Appreciate your support and help to provide this templete
Is this where i get the free template?
Yes Ben. Please scroll to the bottom of the post and you should see the form.