We all know that data is power in the digital marketing world.
But, what happens when your data isn’t consistent?
Since the forced switchover to Google Analytics 4 earlier this year, many marketers are now seeing the direct results of the new system on their reports. Along with changes to common metrics and data points, we’re often seeing a mismatch in stats across marketing channels (no matter how well-configured a Google Analytics account may be).
Today, we’ll help explain why that is and how you can move past these inconsistencies for more comprehensive, informed reporting in 2024 and beyond.
Need help interpreting or setting up your Google Analytics reports? Contact our team to learn more about our GA4 services.
9 Reasons Why Google Analytics is Not Always Accurate to Other Data Sources
Before you panic about inaccuracy between your Google Analytics 4 and other cross-channel marketing reports, you need to understand the context behind it all.
Below, we’ve listed nine common reasons to see a data mismatch across your team’s reports.
1. Changes to GA4 Metric Definitions
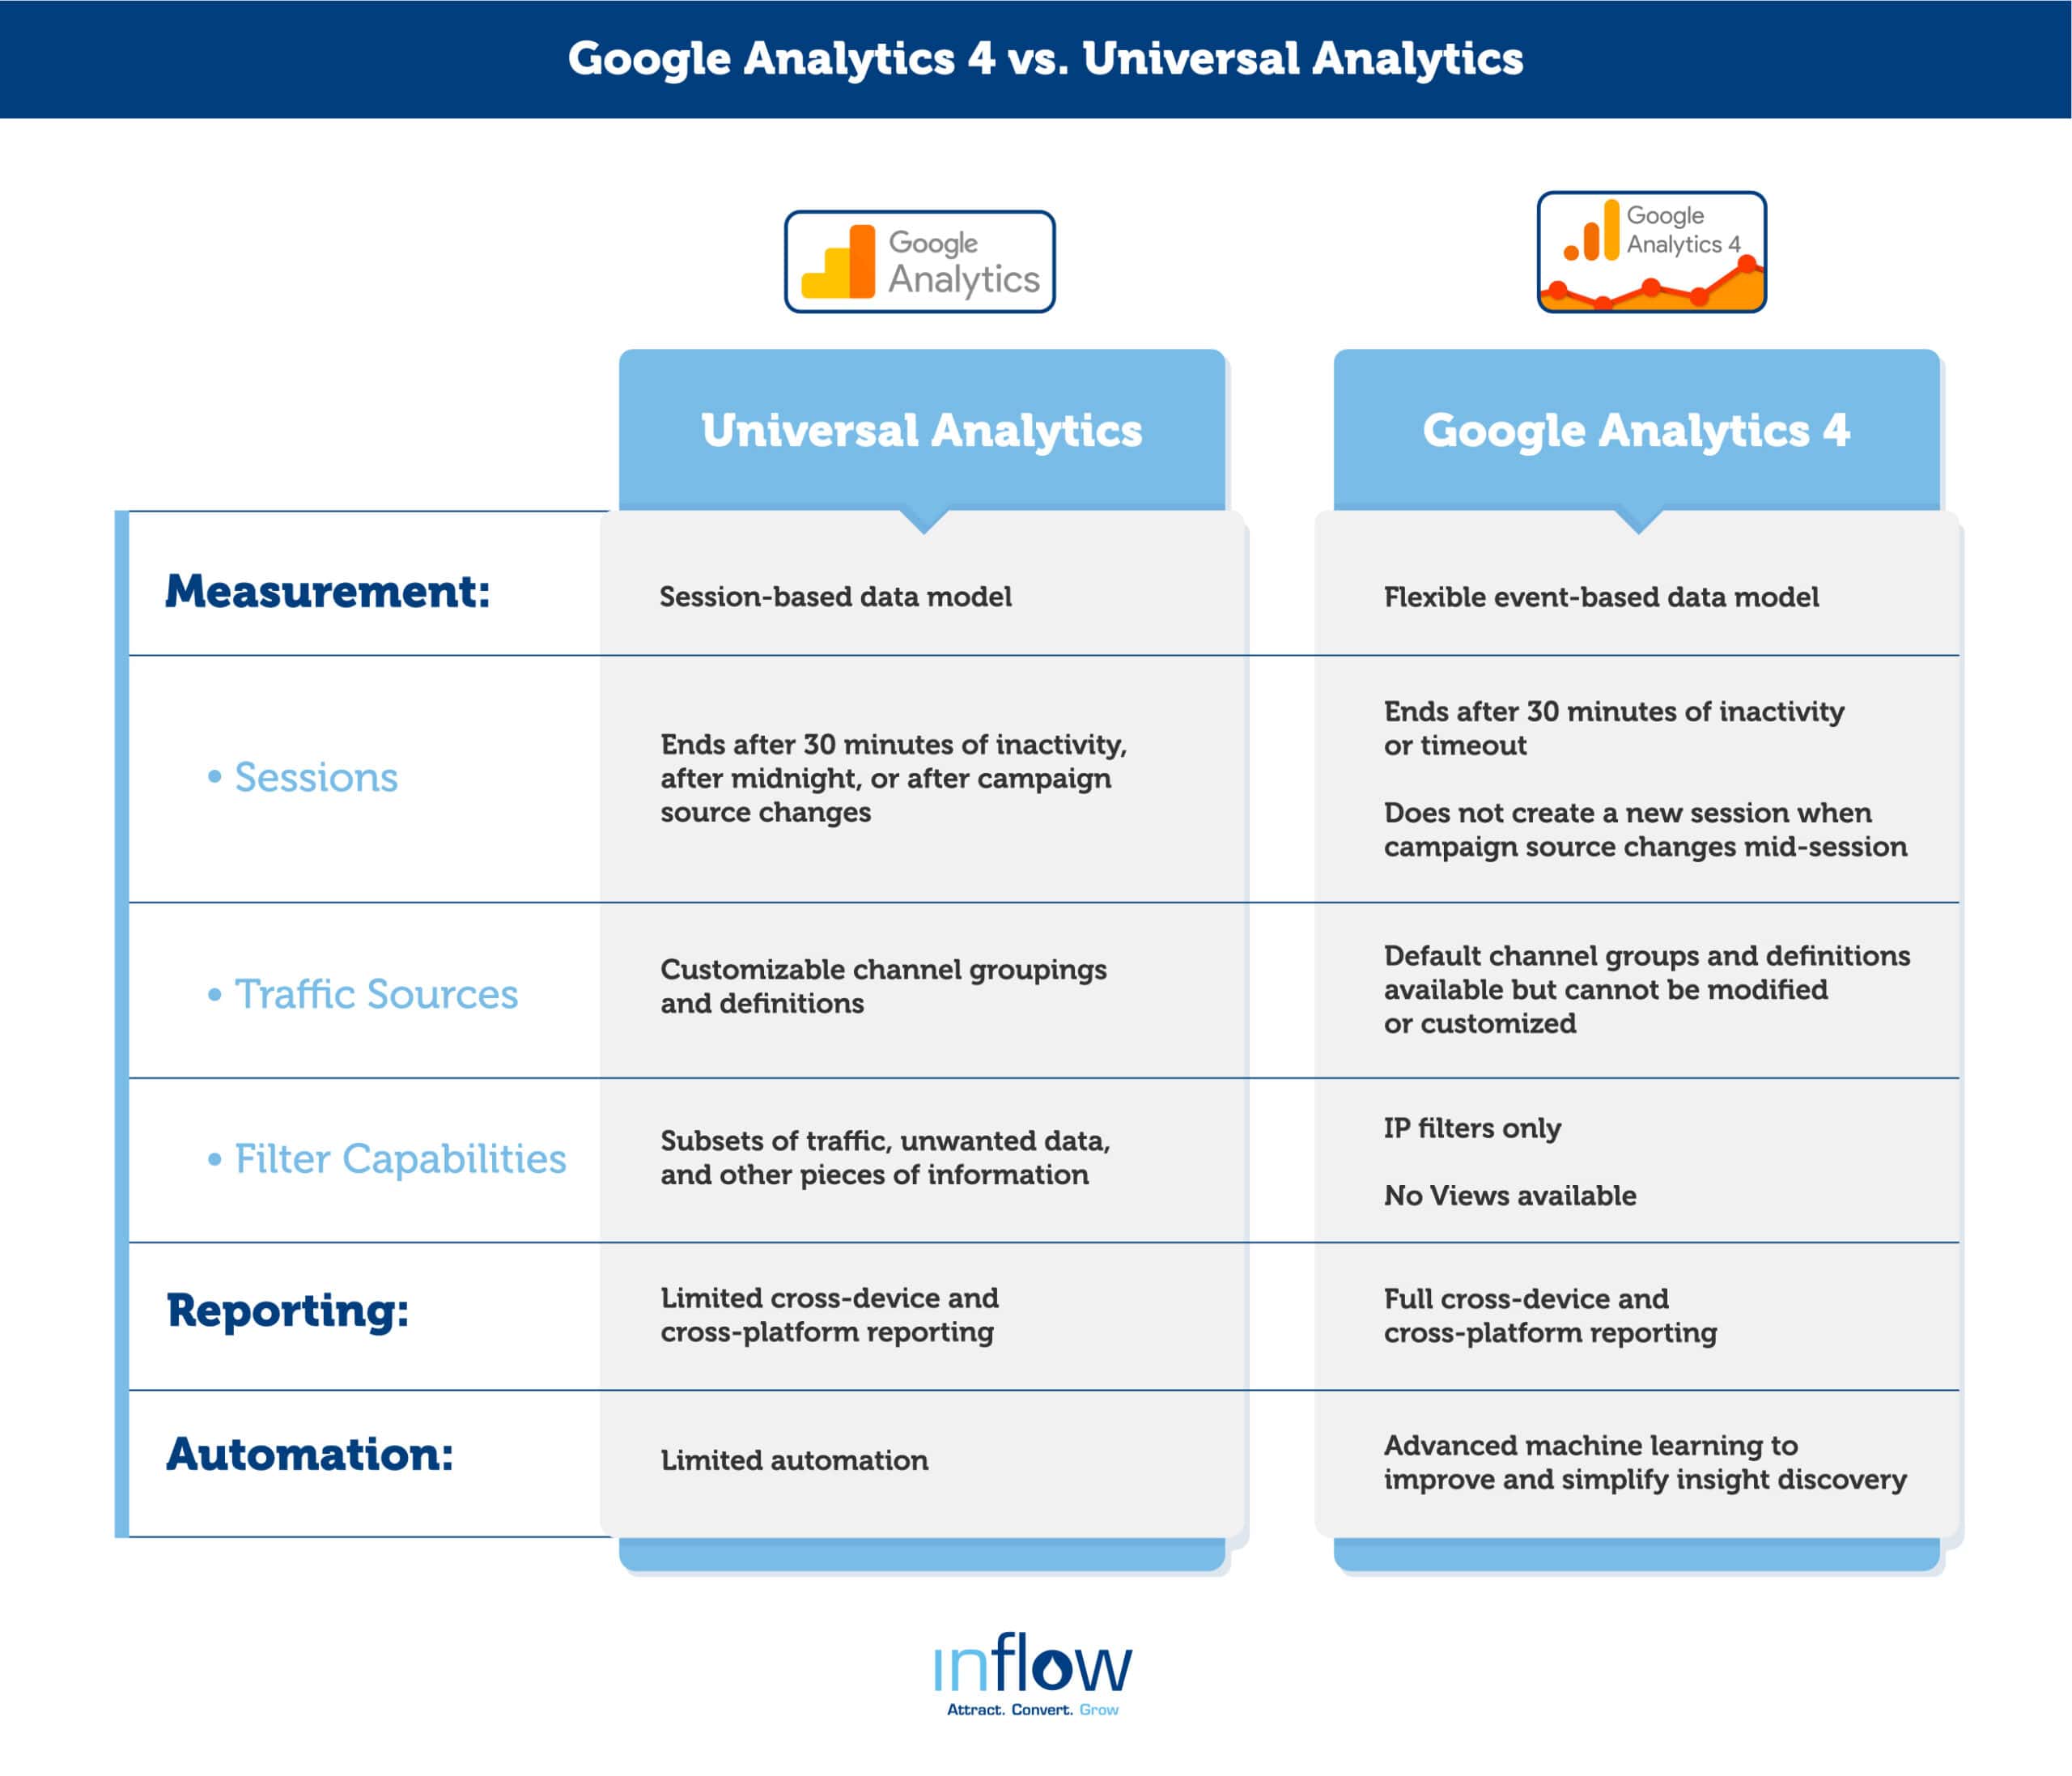
First off, it’s important to note that today’s Google Analytics 4 is completely different than what you’ve been used to in Universal Analytics. So, if you’re using these data points to compare your historical data, you’ll be in for a bit of a surprise.
Unlike the UA of old, GA4 is an event-based analytics tracking system. This means that your GA4 total event counts will be substantially higher than they were in UA, because every pageview, click, scroll, form fill, and purchase will be counted as an event.
The platform has also made some major updates to how certain metrics are defined. For example, a new session is not created in GA4 after midnight, as they were automatically in UA. Bounce rate is also different; now, it’s the percentage of sessions that were not engaged, rather than sessions with no page interaction.

Typically, you’ll see the following inconsistencies in GA4 when compared to UA:
- Lower number of website sessions
- Lower number of users
- More events and conversions
To learn more about how Google Analytics and Universal Analytics compare, you can check out our comprehensive guide here, or watch our explanatory video below:
The video below is hosted on YouTube. If you need assistance with viewing the video, please contact info@goinflow.com.
2. Different Default Channel Definitions in GA4
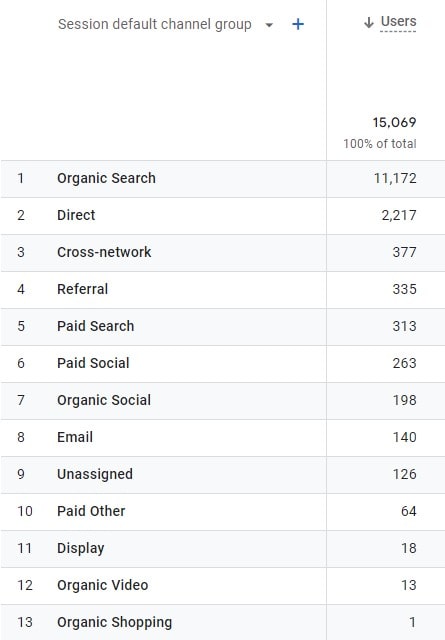
On the same note, you’ll find that Google Analytics 4 has significantly more default channels than UA (17 vs. 10, respectively). Certain channels, such as social, are also broken down into further distinctions, such as paid social and organic social.

Due to these new additions, even traffic channels with the same name in both UA and GA4 may not align — because the user traffic can be categorized differently between the two platforms. We recommend familiarizing yourself with the GA4 default channel definitions, so you can better understand where your traffic is going.
Depending on your original UA set up, you may need to make changes to your UTM to get your traffic into the correct GA4 channel.
3. GA4’s Thresholding of User Data
Google Analytics 4 allows businesses to select Reporting Identities for their site, a way to identify users through either device-based, blended, or observed methods. You can read more about each option in this complete guide, but basically, whichever method you choose has the potential to impact how much data you’re able to view.
At times, to protect individual users’ data, GA4 may use thresholding to hide any particular data deemed too identifying. In other words, if you look too closely at small amounts of data, you can see exactly which data came from which user — something Google tries to avoid.
For that reason, thresholding may prevent certain data from making its way into your standard reports, and you may experience missing conversions, transactions, and more.
The video below is hosted on YouTube. If you need assistance with viewing the video, please contact info@goinflow.com.
4. Ad Blockers & Tracking Blockers
People have caught on to just how much of their data is being collected when they browse the web, and, in turn, many of them are using tools (like ad blockers and tracking blockers) to protect their data.
Whether it’s to improve their user experience by preventing annoying pop-ups, or to avoid the personalized ads that follow them around the internet, ad blockers are easy to implement and commonplace.
The result? You’ll be missing out on data from these users, which will result in some of your Google Analytics data looking incomplete.
Unfortunately, there’s nothing you can do to avoid this use by web visitors — but it’s an important frame of context to have when reviewing your site data.
5. Private Browsers & Disabled Cookies
Similarly, private browsers and disabling cookies allow customers to keep their data confidential from advertisers.
Certain users choose to always browse in a private browser, others are forced to clear cookies when dealing with browser issues, and still others don’t ever think to protect their data this way. It’s a roll of the dice which customers end up on your site (and another uncontrollable reason why your GA4 data may be incomplete).
Note: If you’re using tracking code and cookies on your website, make sure that you’re complying with privacy laws like the GDPR or CCPA, which give website visitors control over what and how much data they’re sharing with you.
6. Bots & Spam Traffic
Of course, not all visitors to your site are actually real customers interested in your company. And, despite your best efforts, you’ll never be able to completely eliminate bots and spam traffic from reaching your site.
While GA4 automatically filters out traffic from known bots, some can still sneak in unknown. Analytics experts like Inflow’s can help you identify those scammers where possible, but know that some may still slip through the cracks to your reports in Google Analytics, Google Ads, or other marketing platforms.
7. Missing Campaign Parameters
Campaign parameters like UTMs are incredibly helpful for measuring which campaigns are driving website traffic — but, unfortunately, UTMs don’t always make it to Google Analytics intact.
Users who share these tagged URLs may choose to strip UTMs for the sake of cleanliness. Certain apps and systems (like Apple’s recent iOS update) may strip these parameters for the sake of privacy.
Whatever the reason, without these UTMs, site traffic to these web pages will likely be categorized as “unassigned” in GA4, which can skew your marketing attribution data.
8. Multiple Devices & Browsers Per User
While Google Analytics 4 attempts to improve upon UA with more robust cross-device tracking through the use of Google Signals, there are still opportunities for missed data.
In addition to the reasons discussed above (private browsers, disabled cookies, etc.), if a user is not logged into their Google accounts across all of their devices and IP addresses, their user ID will not follow their behavior — and it won’t get reported properly in GA4.
9. Different Measurement Methods & Attribution Practices
Finally, just as Universal Analytics and Google Analytics 4 have different data collection processes, so will other platforms like Meta Ads, Google Ads (formerly Adwords), and more.
Take, for example, an eCommerce platform like Shopify.
After you’ve ruled out common errors like poorly configured GA4 accounts and adblockers, you may still see a 10–12% discrepancy between your Google Analytics 4 and Shopify Analytics data, especially when it comes to metrics like transactions and purchases. This is normal and often due to settings that can’t be resolved, such as third-party apps and plugins, inconsistent time zones, and others.
The video below is hosted on YouTube. If you need assistance with viewing the video, please contact info@goinflow.com.
You should also consider how attribution can be different across reports in Google Analytics 4. In some reports (but not all!), attribution can be changed in the admin section. In others, it can not be changed but may be set to something else.
For example, in the “traffic acquisition” report, reported data is session-based and uses the last-touch method — while the “user acquisition” report is user-based and uses the first-touch method.
Comparing the two can result in wildly different conclusions about your marketing campaigns’ success.
Read more about GA4 attribution methods here.
Bottom line: If you’re running campaigns across a variety of platforms, all of which have their own analytics tools, the data usually won’t compare on a one-to-one basis with each other or with GA4.
How You Can Fill In The Gaps With Comprehensive Reporting
So, knowing that some of our marketing data is missing or misrepresented in Google Analytics 4, how do we move forward with detailed, insightful reporting and strategy optimizations?
The key is to approach the challenge with a flexible mindset and an understanding of where all of your data lies (and, no, that’s not just in Google Analytics).
Step 1: Accept that your data may be contradictory at times.
No matter how much troubleshooting you do, your data is simply never going to compare on an exact one-to-one basis across all of your accounts and marketing channels.
Instead of vainly attempting to fit a square peg in a round hole, direct that energy toward educating your team on the “why” (such as the examples listed above). That way, when data inconsistencies arise, you’ll avoid unnecessary panic and wasted time trying to find a “fix.”
The earlier you can get your team to understand and accept the data inconsistencies you’re facing, the quicker you can build a strategy to move forward.
Learn more about preparing your team for GA4’s different reporting styles in our complete guide.
Step 2: Gather data from as many sources as possible.
Whether you love or hate its new iteration, Google Analytics 4 does improve upon some of the data tracking missteps of its predecessor. However, GA4 cannot act as the sole source of truth for your business, especially if you’re running simultaneous campaigns with their own reporting systems.
For this reason, we recommend gathering as much data as possible from as many different sources as you can. The more data you have, the more complete your reporting can be — because you’ll have the context at hand to answer any lingering questions or clear up any inconsistencies across platforms.
(Of course, this approach requires you to fully understand what data is coming from where, what it means, and how it compares across different systems. When in doubt, bring on a web analytics expert to design a strategy for your unique needs.)
Step 3: Build a comprehensive dashboard to see it all in one place.
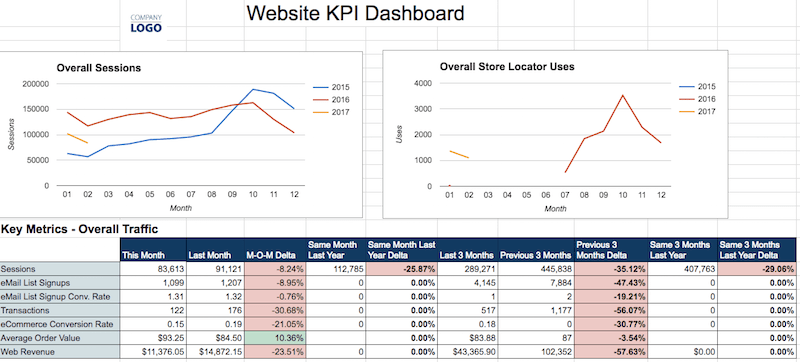
Once you have your data set, we recommend building a dashboard report that serves as your point of reference for any inconsistencies and questions that pop up from your marketing teams.
Here at Inflow, we work primarily with Google Sheets, Looker Studio, and Supermetrics to pull in data from various sources into one mega report. This way, we can put Google Analytics data in context with other business metrics, allowing us to better understand the overall performance of a business and its marketing campaigns.
For a starting point, we recommend downloading our eCommerce KPI Dashboard. The template allows you to customize your data collection and display the metrics that are most important to your business in an easy-to-follow format. Make it as simple or complicated as you want; just make sure that you’re including the most valuable data to shed light on your true business performance.

Download your copy of our template today:
Download Our eCommerce KPI Dashboard now.
Not only does a single report like this highlight any major inconsistencies across your marketing channels, but it also allows us to overcome the shortcomings of relying on Google Analytics alone.
Over the last year, we’ve found that GA4’s strengths come from its inclusion as part of a comprehensive reporting strategy, not as the single source of truth. Like with anything else in digital marketing, it’s best used in combination with other sources and tools — in a way that’s optimized for your particular reporting goals.
Need more help navigating Google Analytics 4 and building a custom reporting strategy for your business?
Check out more of Inflow’s resources below — or reach out to our team anytime to request a personalized proposal for your reporting needs:


0 Comments