Editor’s note: This article was originally published in 2019. It has since been updated for accuracy and modern practices.
Whenever a business makes a site change or redesign, stakeholders want to measure the impact of that decision — more often than not, using conversion rate.
Unfortunately, the way most people look at conversion rate usually leads to incorrect conclusions about impact, efficacy, and strategy.
The solution? Evaluate conversion rates by channel.
There’s no “one ring to rule them all” in conversion optimization. For the most conclusive results, you’ll need to compare several data points.
In this blog, I’ll explain how to do so, using two previous clients as examples.
Want our eCommerce conversion rate optimization team to help you through this process? Reach out anytime.
How Do You Calculate Conversion Rate?
Before we start comparing conversion rates by channel, we need to all be on the same page about where these numbers come from. Knowing how to calculate eCommerce conversion rate is the necessary first step to understanding what these percentages really mean for your business.
Many marketers are surprised to discover that they’ve been calculating conversion rate all wrong. That’s because the most common way to do so (by sessions) isn’t the most accurate.
Instead, we recommend conversion tracking with individual users. This approach takes into account any shoppers who leave and return to your site. Rather than counting them as two users, this method counts them as one — and, for that reason, reflects a higher, more accurate conversion rate.
Learn how to calculate conversion rate by user in our Google Analytics walkthrough.
Evaluating eCommerce Conversion Rates by Channel
Whether you’ve recently redesigned your eCommerce website or run a continuous optimization program, it’s not uncommon to see overall conversion rate appear to drop. But this doesn’t mean it’s time to revert your landing pages or fire your CRO team!
Instead, it’s time to take a closer look at a few different metrics, which could actually reveal you’ve improved your website’s conversion rate.
To avoid this confusion, you need to measure conversion rate by channel, seasonality, device, and more.
Seasonality
Seasonality should be the first factor evaluated in your conversion rate data.
Most businesses have some degree of seasonality, especially those that only operate at certain times of the year. For this reason, your conversion rate over time needs to incorporate seasonality as well as strategy.
Don’t have seasonality data to compare? Use your audience and industry research. For example, if you sell products related to summertime activities, you can reasonably assume purchases will decrease as you approach winter. So, if you see a drop during the fall, don’t automatically attribute it to any site changes.
Take seasonality into account anytime you review conversion rates. While smaller than peak results, low numbers might actually be strong performers for certain seasons!
Traffic Volume
If a business increases its traffic dramatically (whether via paid, organic, referral, direct, or other), it always experiences a decrease in conversion rate, too.
Why? Dramatic increases in traffic are due to increased exposure to new audiences. But, because the increased exposure is not as targeted as prior traffic, the number of visitors who convert is lower.
Let’s say your business suddenly ranks for a bunch of brand-new terms in Google. Before, you may have only been ranking for high-conversion phrases like “slinky” — but, when you start ranking for more general terms like “toys,” you’re not capturing the same kind of audiences who are ready to make a purchase.
Whatever the reason, I can confirm this traffic/conversion rate rule holds true for every client Inflow has ever worked with.
Traffic Channels
Here’s the truth: Conversion rate changes over time are far more influenced by traffic channel mix than by improvements to the site.
It makes sense: While changes to your site might influence your customers’ behavior, the kind of website visitors being brought to your domain is much more important.
Let me walk you through an example.
After we implemented site changes for a small startup client, the following chart made it appear the conversion rate was better before the changes (or at least not affected by them).
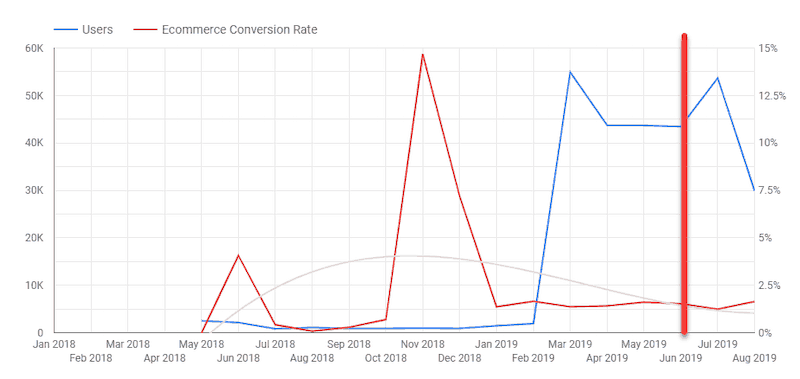
A few factors are at play here:
- There is no seasonality data. Because this client was a startup and operates in a highly seasonal vertical, the exclusion of this data is particularly problematic.
- The chart doesn’t show traffic volume, which can dramatically affect conversion rate.
- The chart also doesn’t show the traffic channel mix, which (as we’ve mentioned) is by far the most important factor for time-based conversion rate analysis.
Given its importance, let’s dive a little deeper into just how traffic channels came into play for this client.
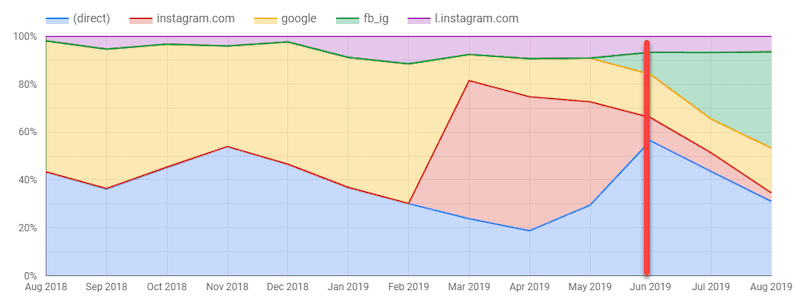
The above chart shows the client’s changes in traffic patterns over time. Take a close look at the Instagram line.
Prior to our site changes, Instagram traffic had been declining as a percentage of this client’s total traffic, and it continued to decline after our updates, too. Unfortunately, Instagram was this client’s best-converting channel. Its decline in traffic ended up dragging the overall conversion rate down with it — even though the Instagram traffic converted at about the same rate before (“I.instagram”) and after (“instagram”) the updates.
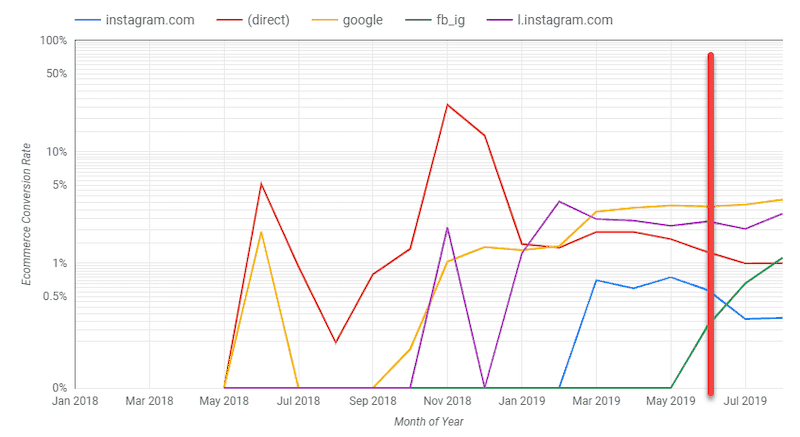
At the same time, social media CPC traffic (fb_ig) began to rise. But, with an initial conversion rate of only 0.25%, it created a double-hit effect on the client’s overall traffic. As it ramped up in volume over time, the conversion rate increased, pulling the overall conversion rate back to 1%, where it was below our site updates.
Note: This is an important exception to the “as traffic increases, conversion rate decreases” theory. Because this client had neglected paid Instagram, there was nowhere for the conversion rate to go but up as it brought in more traffic. We’d expect the same effect if a client started PPC efforts (Iike Google Ads) from scratch, as well.
So, in this example, did the site updates make a positive impact?
You’ll find the answers in the traffic sources that were stable in terms of volume. For this client, those are “direct” and “google.”
Direct is a black box — so it’s not the best candidate. However, Google is one of the harder customer acquisition channels to budge.
In this case, Google organic traffic volume stayed about the same throughout the updates. But, when looking at its conversion rate, we see it go up in the two months following the site updates.
Therefore, we can confidently say the site improvements worked for organic audiences coming through Google’s search engine. Knowing that, we can also assume the site changes worked for the other marketing channels, too, although any higher conversion rates are hidden by the changes in those traffic sources.
While not a satisfying answer for upper management, it’s an accurate reflection of how the website is actually doing in terms of converting users. If we hadn’t evaluated this conversion rate by channel, we would have made a serious error in our calculations and strategy.
Device
Device type used is another important factor when looking at your overall conversion rate. And we’ve got another client example to show you why.
Prior to partnering with Inflow, one of our clients had revamped their mobile smartphone experience. Unimpressed with the before-and-after results, they asked our team to analyze their implemented changes.
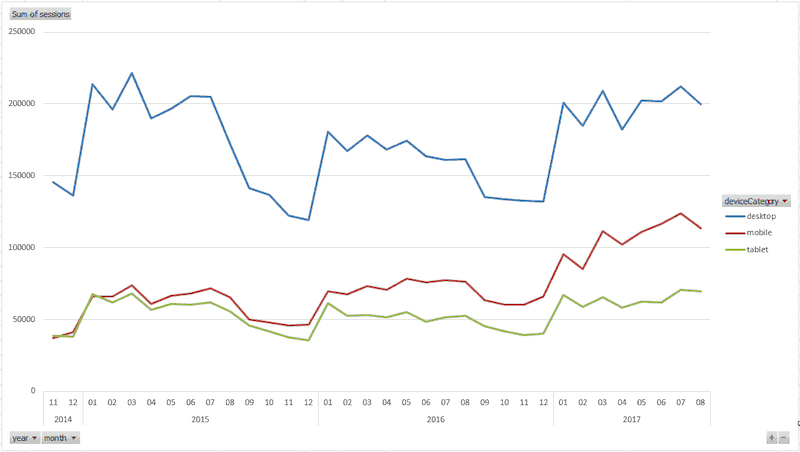
When looking at top-line average conversion rate by device over time, we don’t see a lot of improvement in mobile performance after changes were made in February and March of 2017. Knowing that their peak season is usually in November and December (and seeing it reflected in the chart below), we took a second look.
During that peak time period, we can see a huge shift toward mobile, partly due to the client’s now-SEO-friendly site and partly due to the global shift to mobile devices. (Prior to this year, the client had an older demographic and was therefore behind the curve in terms of transition to mobile.)
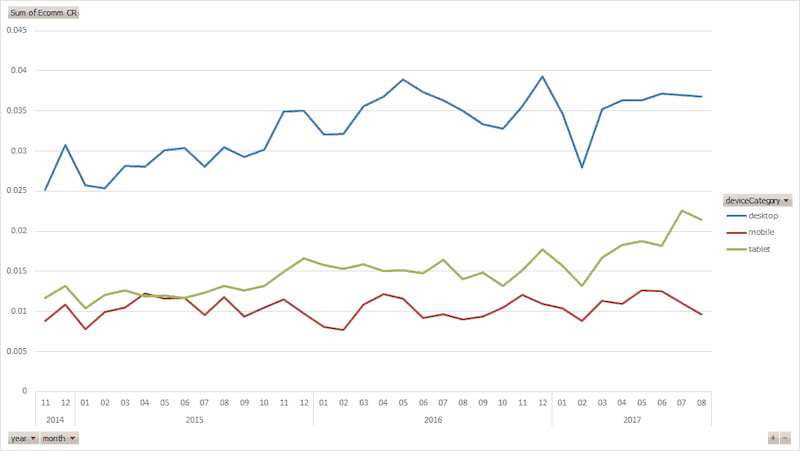
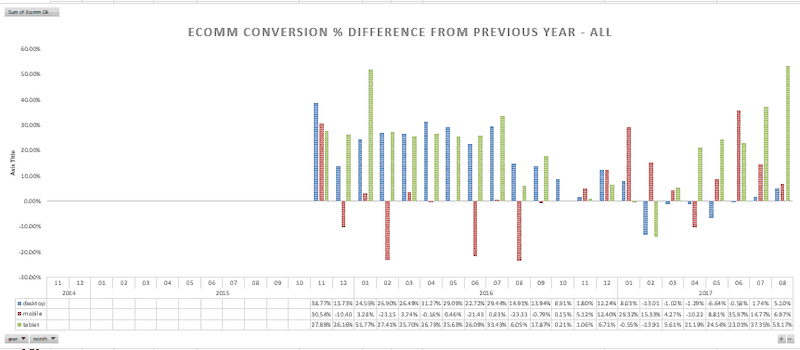
Because the client had such strong seasonality effects, we needed to focus on year-over-year changes. So, we took a look at year-over-year eCommerce conversion rate by device (demonstrated in the chart below).
Of the top six months of highest conversion rate, year-over-year, for this time period, four of them occurred after or during the redesign. For us, this was enough to prove the redesign was a success — but the client was still not satisfied with this explanation.
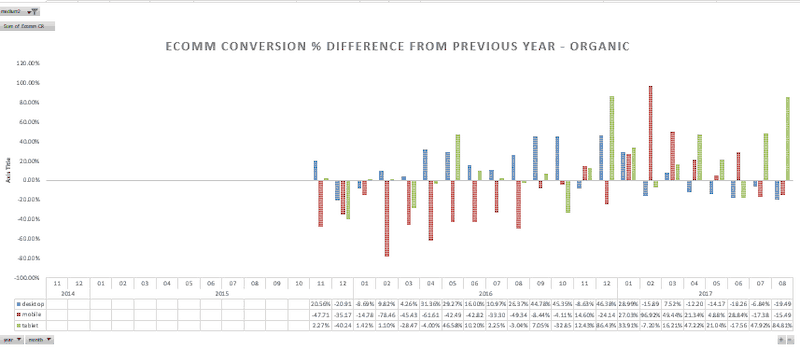
Next, we dug deeper into conversion rate by channel. Without burdening you with all of the messy data, we discovered the key dynamic for mobile was organic — that is, the large increase in mobile traffic volume in the chart above was driven by organic sources.
In total, organic traffic increased 2.5x in the period after the redesign. But, remember the rule of numbers: As traffic increases dramatically, the conversion rate decreases. This case was no different, and the organic conversion rate declined significantly year-over-year.
So, the redesign wasn’t successful after all, right? Not exactly.
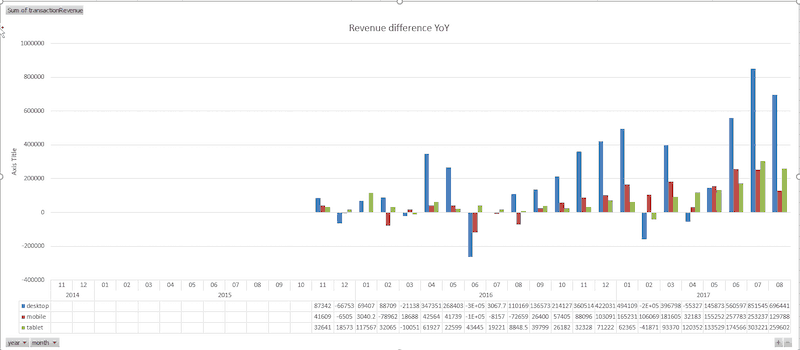
Because you can’t pay for a trip to Hawaii with conversion rate, we evaluated revenue, which includes both volume and conversion. Even though the overall conversion rate decreased dramatically, mobile year-over-year revenue was the best it’s ever been, due to the dramatic increase in organic traffic volume:
Bottom Line: Always Look at All the Data
Conversion rate is a great benchmark to track for eCommerce businesses — but it shouldn’t be the end-all, be-all of your performance. It’s merely an indicator, not a measure of website success.
For the fullest picture of your results, always remember to take into consideration these different conversion rates by channel: seasonality, traffic volume, traffic channels, and more. It will take more time, but your analysis will be cleaner, more informed, and better support your future inbound marketing strategies.
If you need assistance evaluating the impact of a site change on your conversion rate, our team of digital marketing experts is always willing to help. Reach out anytime for a personalized proposal and plan of action for your business.


0 Comments