When it comes to evaluating eCommerce site performance, many digital marketers and business owners live and die by conversion rate. Knowing how many of your site visitors are converting to final sales helps you identify gaps in your sales funnel, optimization opportunities for your landing pages and checkout process, and more.
But what if we told you that the most common way to calculate conversion rate isn’t the only way — and isn’t necessarily the best way either?
By default, most analytics tools, including Universal Analytics (a.k.a. GA3), report session-based conversion rates (ie., the number of sessions that turn into sales). But, when it comes down to it, site conversions/sessions may not be the best way to calculate the conversion rate of a site.
Conversions and users are.
Today, we’ll show you how to track your eCommerce conversion rate through this lens, using the new-and-improved capabilities of Google Analytics 4.
Not sure if you’re using the right conversion rate for your business needs? Let our team audit your Google Analytics 4 setup to optimize your usage of the analytics platform.
Conversion Rate: Users or Sessions?
First, let’s talk about why tracking by sessions can be so detrimental to your eCommerce reporting strategy.
Of course, it’s nice to know how many site visits turn into a sale. But there’s a huge caveat in what this number is (and isn’t) telling you.

When you track conversion rate by sessions, you’re tracking the number of visitors that came to your online store without buying anything.
What you’re not tracking: whether those same people came back later and eventually made a purchase.
A customer’s sales journey is more complicated than ever, but a typical conversion rate based on site visits does not take into account this longer sales cycle. In short: If you don’t track your rate by users, you’re leaving valuable data on the table.
Unfortunately, for many years, the default option for calculating user-based conversion rate in Google Analytics made that difficult and unwieldy. With Universal Analytics’ structure as a sessions-based platform, marketers had to dig to discover exactly how many customers (not site visits) converted into sales for a better picture of this crucial metric.
But not anymore.
With the changeover to Google Analytics 4, your eCommerce business can now get better insights than ever with user-based conversion rates — a metric we’ve been embracing for years for our clients.

Why We Recommend User Conversion Rate
If you’re currently tracking conversion rate by session, good news! Your website might actually have a higher conversion rate than you think, especially if a high percentage of your customers visit more than once before making a purchase.
Let’s look at an example:
Say a potential customer is comparing a product across competitors. They might initially visit your site, then visit other sites for comparison — only to come back later and make a purchase. Because they visit your site in two separate instances, they total two sessions, even though they only make one purchase.
Depending on how you calculate your eCommerce conversion rate, you’ll get a wildly different measure of success:
- Sessions-based conversion rate: 50%
- User-based conversion rate: 100%
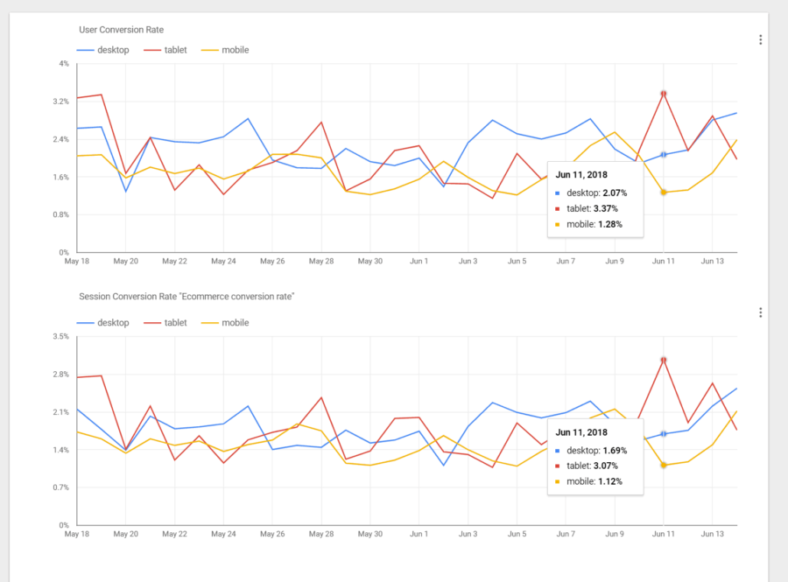
It’s not just in hypotheticals, either. We see it in our client reports, too, including these rates for one of our clients in the travel industry:
- Sessions-based conversion rate: 1.96%
- User-based conversion rate: 2.24%
Note: While user-based conversion rate is arguably better than session-based, it’s still far from perfect in Google Analytics 4. The platform can still have difficulty identifying unique website visitors, thanks to user privacy rules, apps that block tracking, and more.
Google Signals is a big component of how the platform can identify users across desktop and mobile devices and browsers. Depending on your settings (and whether or not you even have Google Signals turned on), you may get incomplete user data, which, in turn, will affect user-based KPIs like conversion rate.
The video below is hosted on YouTube. If you need assistance with viewing the video, please contact info@goinflow.com.
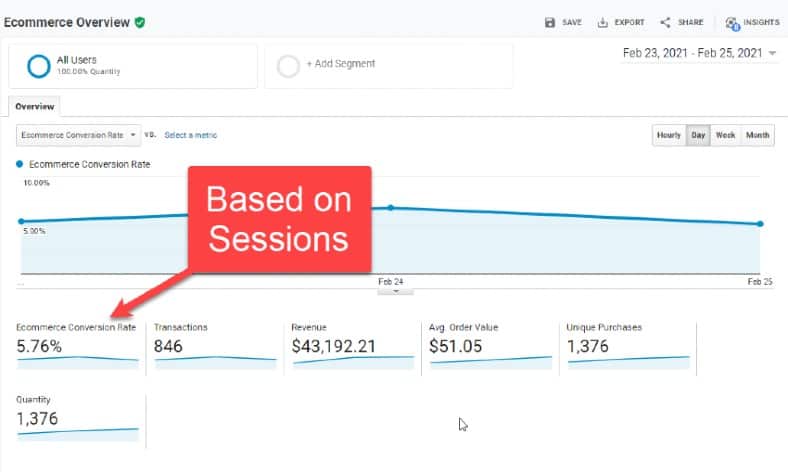
Even so, user-based conversion rate is a better reflection of your true conversion rate than the default sessions-based conversion rate you’ve been used to in Universal Analytics (shown in the screenshot below).

Why Do So Many Tools Default to Session-Based Conversion Rate?
If a user-based conversion rate is more effective than a sessions-based rate, why do so many tools automatically report on the latter?
The answer: It’s much easier to calculate a conversion rate based on sessions.
When tracking by session alone, an analytics tool doesn’t need to store as much data. But calculating a user-based conversion rate means going back in time to track all sessions from a single user (assuming a user can be identified relatively well across browsers and devices).
This requires more computing power and user tracking. It’s also why the development of Google Analytics 4 took several years — and, even after launch, developers are continuously fixing bugs and adding new capabilities to the platform.
Finding Your User-Based Conversion Rate in Google Analytics 4
Fortunately, calculating your new user-based conversion rate in Google Analytics 4 is much simpler than it was in Universal Analytics. We’ll walk you through the steps below.
That said, if you haven’t yet migrated your tracking and reporting to GA4, make that your first step. You can start with our free GA4 eCommerce Tracking Toolkit, which provides everything you need to configure the basics of your account.
Once you’ve got your accounts up and running, finding your eCommerce conversion rate in your Google Analytics reports is simple.
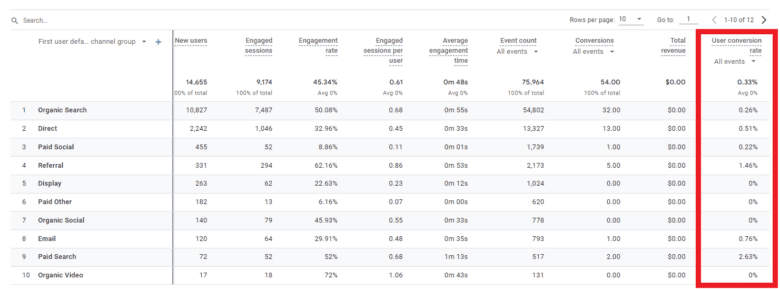
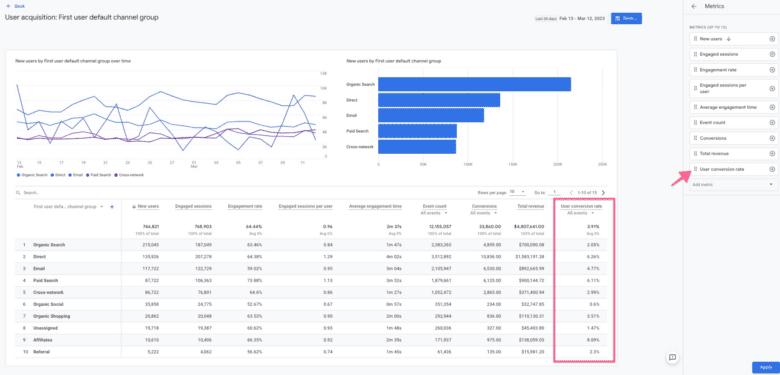
First, navigate to a user report like the User Acquisition Report. There, you’ll see by default metrics like users and conversions, both of which you need to calculate your user conversion rate.
You’ll need to customize the report by clicking on the pencil icon and adding User Conversion Rate as a metric. Keep in mind, even if you’ve changed the Attribution Model (default is data-driven), that won’t be reflected in this report — because User Conversion Rate always uses the First Visit Source to attribute conversions.

A bit more info about your First Visit Source:
This metric is attributed based on the last non-direct click model and only applies to interactions that take place before a user’s first website visit (or first app open). Any interactions following that first click or first open aren’t used in this attribution.
Therefore, once it’s assigned, the First Visit Source for a particular user will remain unchanged (the caveat being whether GA4 can technically link activity on both the website and any app to the same user).
If the tracking of the user is lost (ie., the user doesn’t visit the website for a period longer than the Analytics cookie expiration date), then the First Visit Source will be reset.
Other Common Mistakes: Looking at Conversion Rate Too Broadly or Too Often
Now that you have your user-based conversion rate, it’s tempting to follow its movement on a regular basis — monthly, maybe even weekly or daily. But doing so can seriously skew your perspective of how your site is performing.
Think about the length of your buying cycle. If you have a long buying cycle or tend to have a high session-to-purchase ratio, the shorter timespan you analyze, the lower your conversion rate will likely be.
Another common mistake in analyzing your eCommerce conversion rate is looking at your user-based conversion rate in a vacuum.
Think about all the ways people get to your site, such as organic traffic, Google Shopping campaigns, and social media channels. Remember that:
- Each channel has its own conversion rate.
- They are all constantly in flux.
- They all add up to your overarching conversion rate.
If you make considerable changes to one of these channels, it will — for better or worse — dramatically impact your traffic and conversions.
For example, your conversion rate might peak and tank during and after a major advertising or marketing campaign. But that temporary decrease in your conversion rate isn’t something to worry about.
Instead, you need to look at the big picture: If you see an overall increase in revenue after the campaign, it’s a win. And, remember, your conversion rate should level out (or, even better, rise!) over time.
Instead of worrying over week-to-week or month-to-month changes to your rate, we recommend watching your conversion rate’s movement in these three situations:
- As a year-over-year (YOY) rate, to see how your eCommerce website is doing in the long term
- During major shopping times, such as the holidays, when quick changes are vital
- After implementing major site changes, which you’ve previously trialed with A/B testing
The Next Step: Increasing Your Conversion Rate Through a Long-term Marketing Strategy
Now that you know how to properly calculate your conversion rate in the most accurate way, you can better track the success of your conversion rate optimization campaigns.
We recommend starting with our list of 44 CRO tactics — and, when you’re ready, bringing on a team of CRO experts for a personalized site audit and improvement proposal.
With consistent product, promotion, and site strategy, your eCommerce conversion rate should increase year-over-year. Tracking a user-based conversion rate in Google Analytics 4 will give you the best representation of that growth — and is just one way to see whether you’re building long-term customers for your eCommerce store.


I know this is an older article, but I see a ton of places recommending User Conversion vs Session conversion. For both the math is transactions/Session or User. The question is transactions. If customers make multiple purchases, are they really attributable across other users? If 10 visitors hit your site, each with 1 sessions and 1 of them places 10 orders, it would be incorrect to state that you have 100% conversion in either instance. You have a 10% conversion rate 1/10 customers placed orders – 1/10 sessions placed orders. If tat same customer placed 10 orders and 1 other customer placed 1, does that mean you have 110% conversion or do you have 20% conversion? I would say its 20%. The assumption that a customer would only place a single order is a bad assumption and attributing their multiple orders to all customers is also misleading
Hi, John — Great insight, and a great example of why we suggest using a comprehensive view of your eCommerce conversion rate rather than taking all numbers at their face value (no one is really suggesting that you attribute multiple orders to users who did not make an order).
It obviously depends on your business, but most folks will only be counting one conversion per user. (Important to note that while Universal Analytics only counts one conversion per session, Google Analytics 4 does count every conversion.)
Of course, once you have a decent amount of traffic, these kinds of distinctions won’t be as obvious or matter as much as they would with a smaller site. However, even with low traffic, we typically don’t see such extreme purchase behavior from customers — but, if we did, we’d understandably use a different KPI than conversion rate, for the reasons you’ve pointed out.