While the Google Ads platform should always be your single source of truth for PPC performance, recent developments within Google Analytics 4 now allow for more comprehensive cross-channel analysis — giving today’s advertisers a more extensive understanding of their paid search performance in context of overall marketing initiatives.
In Inflow’s latest webinar, I teamed up with my colleague Jeremiah Zgliczynski to detail all those reporting features, along with our recommendations for using that Google Ads data in GA4 to inform campaign optimizations.
The complete webinar is now available for viewing on-demand — but, for ease of access, we’ve also documented all of GA4’s Google Ads reports in the guide below.
The video below is hosted on YouTube. If you need assistance with viewing the video, please contact info@goinflow.com.
Bookmark it and revisit it as needed to build your ideal Google Ads reporting dashboard.
(Or, if you’d rather our team do the hard work for you, request your custom dashboard today.)
Table of Contents
- Data-Driven vs. Last-Click Attribution
- Google Ads Reports in GA4
- Get a Personalized Google Ads Reporting Dashboard
Data-Driven vs. Last-Click Attribution
Before you start analyzing any data in your GA4 Google Ads reports, you need to understand the platform’s differences when it comes to attribution.
Google Analytics 4 presents two options for Google Ads conversion tracking and analysis:
- Data-driven attribution: Distributes credit for the key event based on data for each key event
- Last-click attribution: Ignores direct traffic and attributes 100% of the key value to the last channel that the customer clicked through before converting
In general, data-driven attribution provides the clearer picture of exactly which channels (paid and organic) are contributing to your conversions, in comparison to the single-channel view of last-click attribution. Which attribution model you use will also affect your reporting in a big way, as you’ll see below.
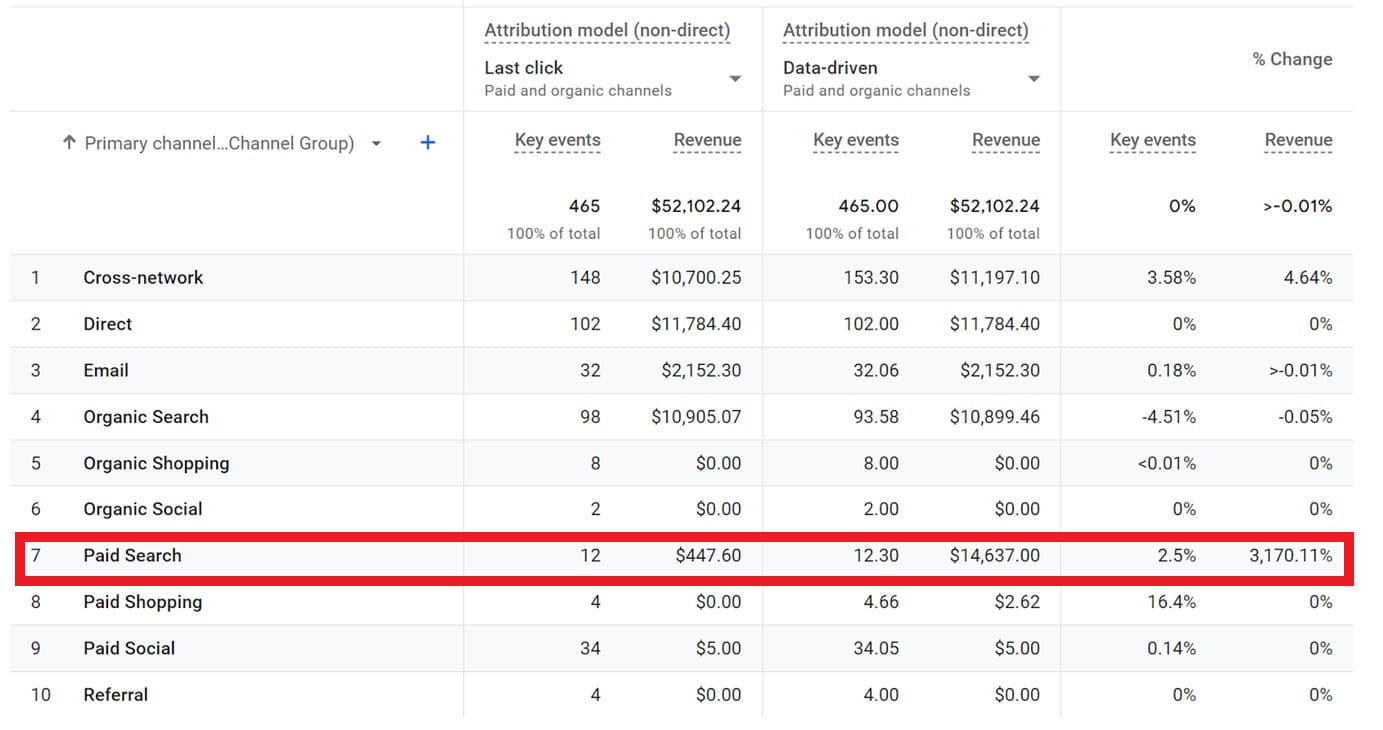
In this client example, there is a $14,000 revenue difference between these attribution models. In the last-click model, paid search received no credit for helping to attract and eventually convert this single massive purchase. Data-driven attribution, on the other hand, gives the channel its proper credit.
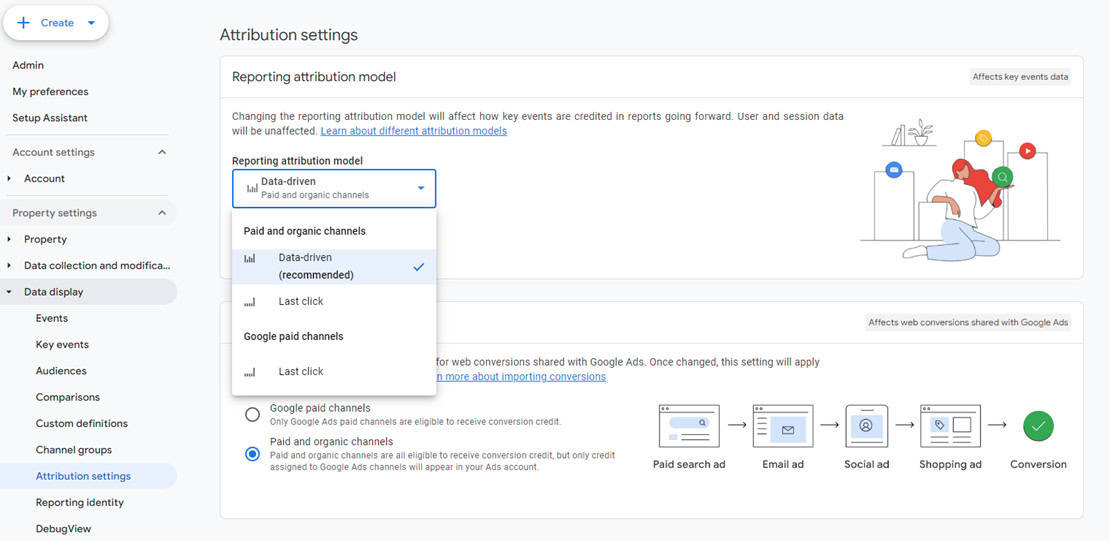
Here at Inflow, we recommend our clients use data-driven attribution. You can toggle between data-driven and last-click attribution in the “Attribution settings” section of your Admin dashboard. However, note that any changes made are not retroactive and will only affect reporting moving forward.
We’ll go into more detail on these attribution options (and their impact on data reporting) later on in this guide — but keeping this demarcation in mind will be key to creating accurate Google Ads reports in GA4.
7 Google Ads Reports in GA4 to Use
As mentioned above, the Google Ads platform is generally the best place to explore your campaign performance, especially on a granular level.
But, if you’d like to view your performance in terms of other marketing channels, GA4 offers several helpful reporting features to help you do so.
The video below is hosted on YouTube. If you need assistance with viewing the video, please contact info@goinflow.com.
1. Advertising Snapshot
If you’re looking for an efficient, overarching view of your Google Ads performance, the Advertising Snapshot is the report to use.
Within it, you’ll find:
- Conversions over time
- Conversions by default channel group
- Key events by primary channel group
- Key event paths
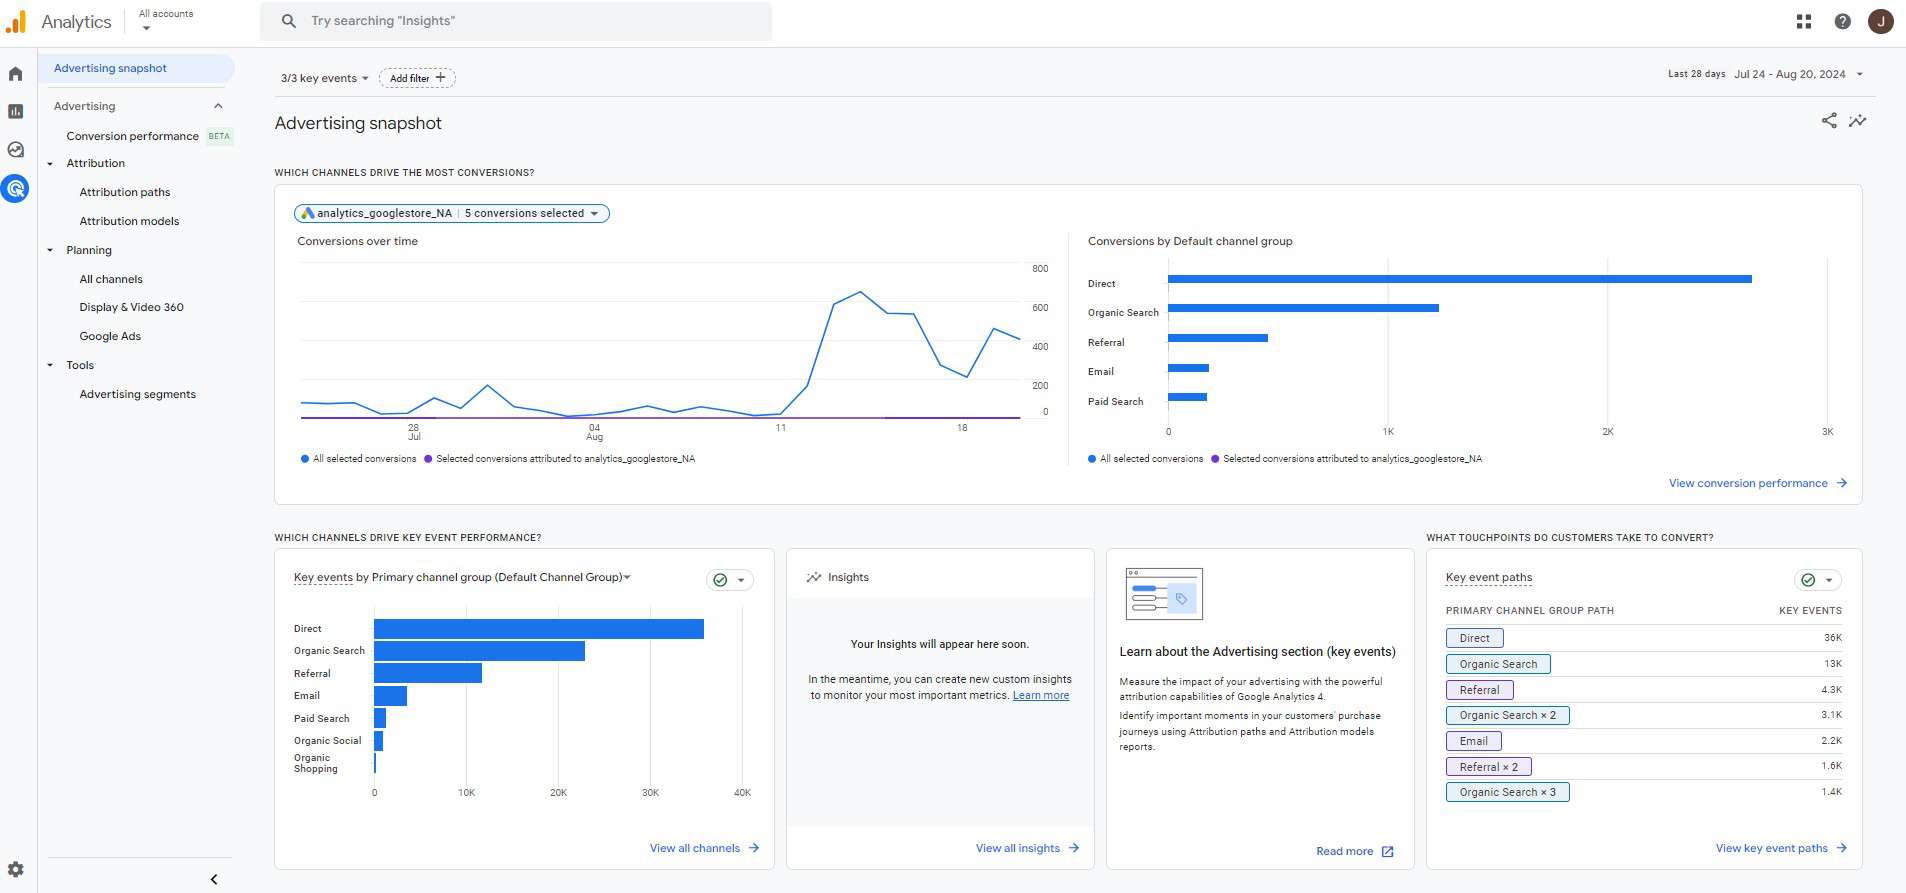
This report is perfect for those who need a quick rundown of their PPC campaign performance. You’ll find it under “Advertising -> Advertising snapshot.”
If the Advertising button is not visible within your GA4 account, your accounts may not be linked. Follow this step-by-step guide to link your GA4 to your Google Ads account.
2. Attribution Paths Report
To see how many touchpoints led to a key conversion event on your site, use the Attribution Paths report (“Advertising -> Attribution -> Attribution paths”).
You can personalize this report by changing the channel group and the attribution model (two of which we discussed above). You can also change dimensions and sort the report by different metrics.
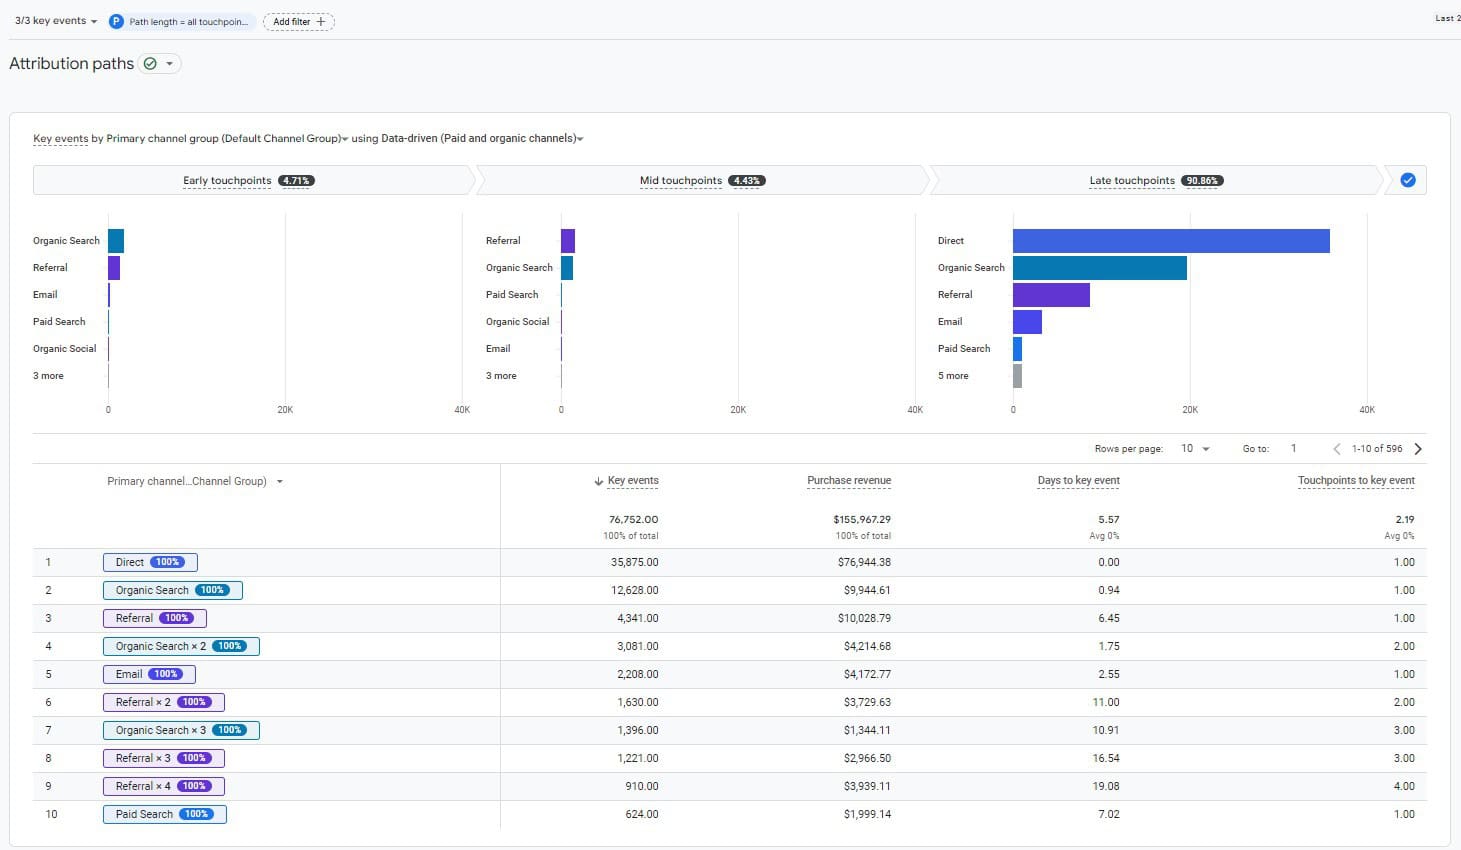
Unfortunately, Google Analytics 4 does not replicate the “assisted revenue” metric that Universal Analytics provided advertisers. Instead, marketers must use these attribution paths to estimate the “value” of each touchpoint, from which they can make informed budgeting decisions.
Let’s look at another eCommerce client example.
As you can see, those key events with only one channel (lines 2, 4, 7, and 8) attribute 100% of the revenue to those channels. However, those with multiple touchpoints across several channels break out that credit across those touchpoints, attributing different percentages to different marketing channels.

If we were to review this data in the attribution models report (discussed below), we’d see percentages of conversions reflected in the data-driven attribution column. With last-click attribution, all of those previous touchpoints would be ignored, and all revenue would be attributed to one single channel — which can greatly skew your marketing analysis.
For this reason, we highly recommend using the Attribution Paths report to understand not only your overall marketing performance but also your customer behavior. Based on what you see, you’ll get a better view of how much impact each channel has, where all the customer touchpoints are coming from, and how it all interacts to eventually drive a sale.
3. Attribution Models Report
No GA4 Google Ads report is better for displaying the effects of attribution than the Attribution Models report (“Advertising -> Attribution -> Attribution models”).
This report compares key events and revenue by channel based on last-click and data-driven attribution models. (You can personalize your selected models based on what you’d like to see.)
In this GA4 demo account, we see slight discrepancies across models, often to the tune of a couple hundred dollars.
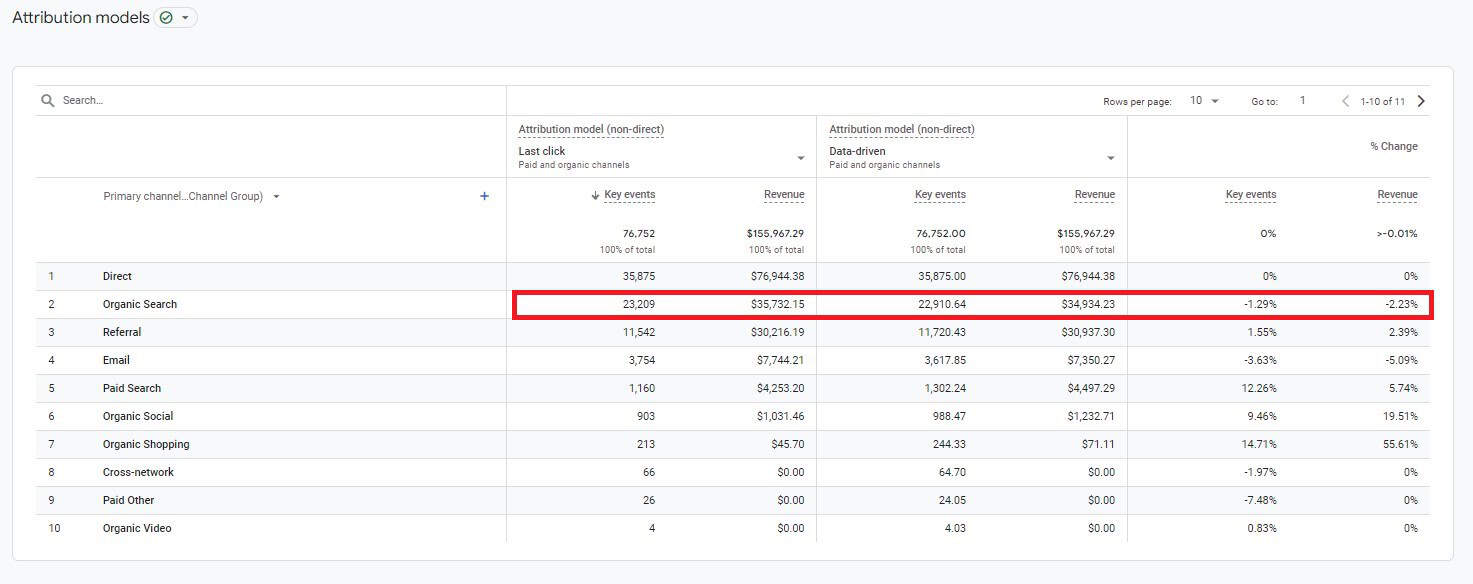
However, there are times that changing your GA4 attribution model can have a huge effect on this report. Again, we look at the client example shared above, in which data-driven and last-click models demonstrate a $14,000 difference for one of our clients:

Had this client relied solely on last-click attribution to evaluate paid ads efficiency, they’d be misled into thinking that their Google Ads campaigns had no impact on the major $14k purchase — when, in fact, they were instrumental in that customer’s buying journey.
Therefore, this side-by-side comparison makes the Attribution Models Report a must-review for evaluating marketing campaign efficiency.
4. All Channels Report
The All Channels Report (“Advertising -> Planning -> All channels”) compares your Google Ads activity to all other marketing channels.
Of course, any metrics associated with your PPC campaigns (ad spend, cost per key event, ads clicks, ads cost per click) will display as zero for non-paid efforts — but, by including metrics like key events and total revenue, the report allows you to directly contrast the effectiveness of your PPC campaigns against other channels in one place.
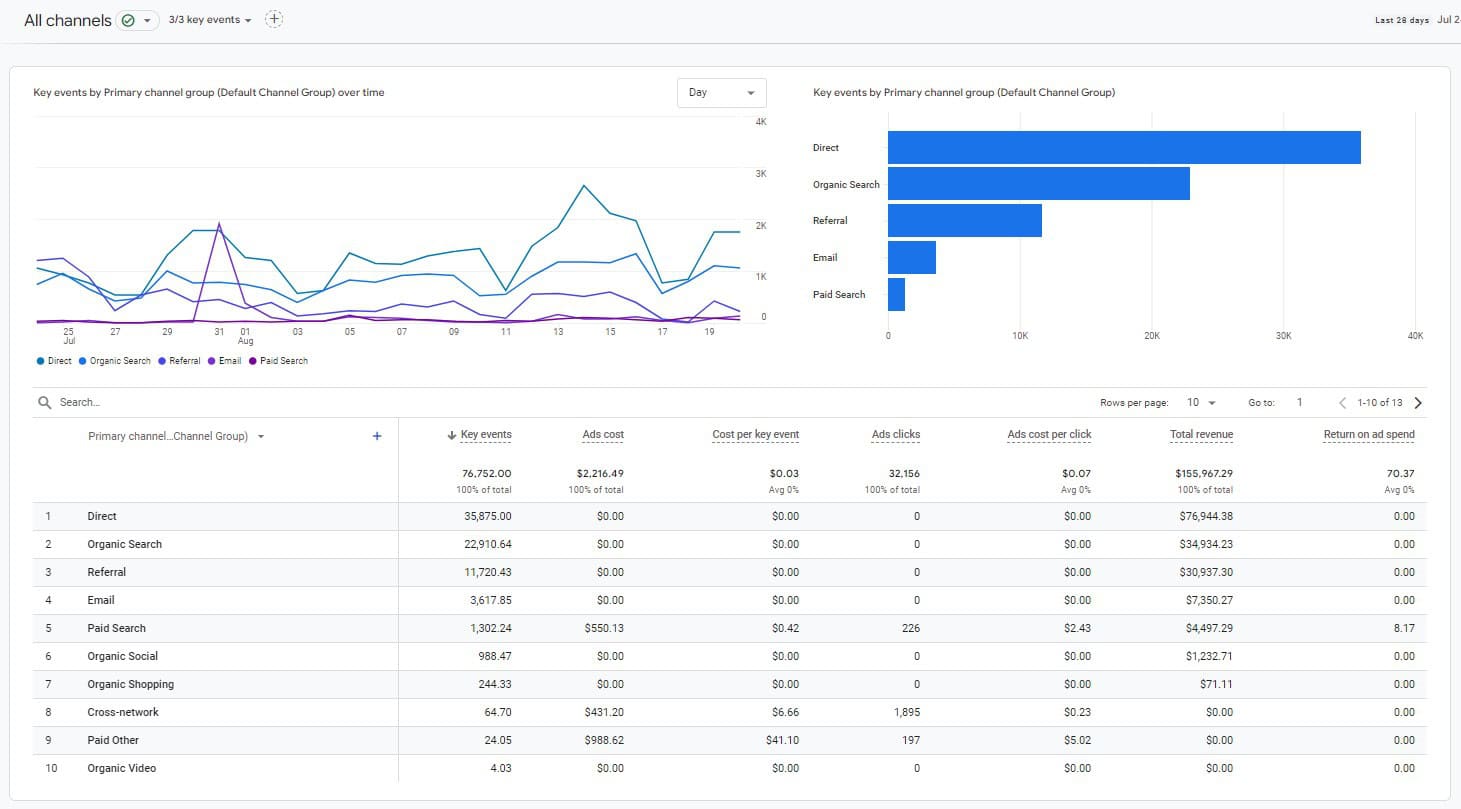
Your Google Ads account will provide more detailed information on these PPC metrics (and we’d encourage you to use a combination of reports when analyzing performance) — but, like the Advertising Snapshot, the All Channels Report is a useful overview of how your marketing channels compare from a high-level view.
5. Display & Video 360 Report
If you’ve linked your Display and Video 360 ads to your Google Analytics 4 account, this report will provide another high-level view of performance.
You can adjust this report to view key metrics by campaign name, campaign ID, and many other dimensions — similar to how you would in Google Ads.
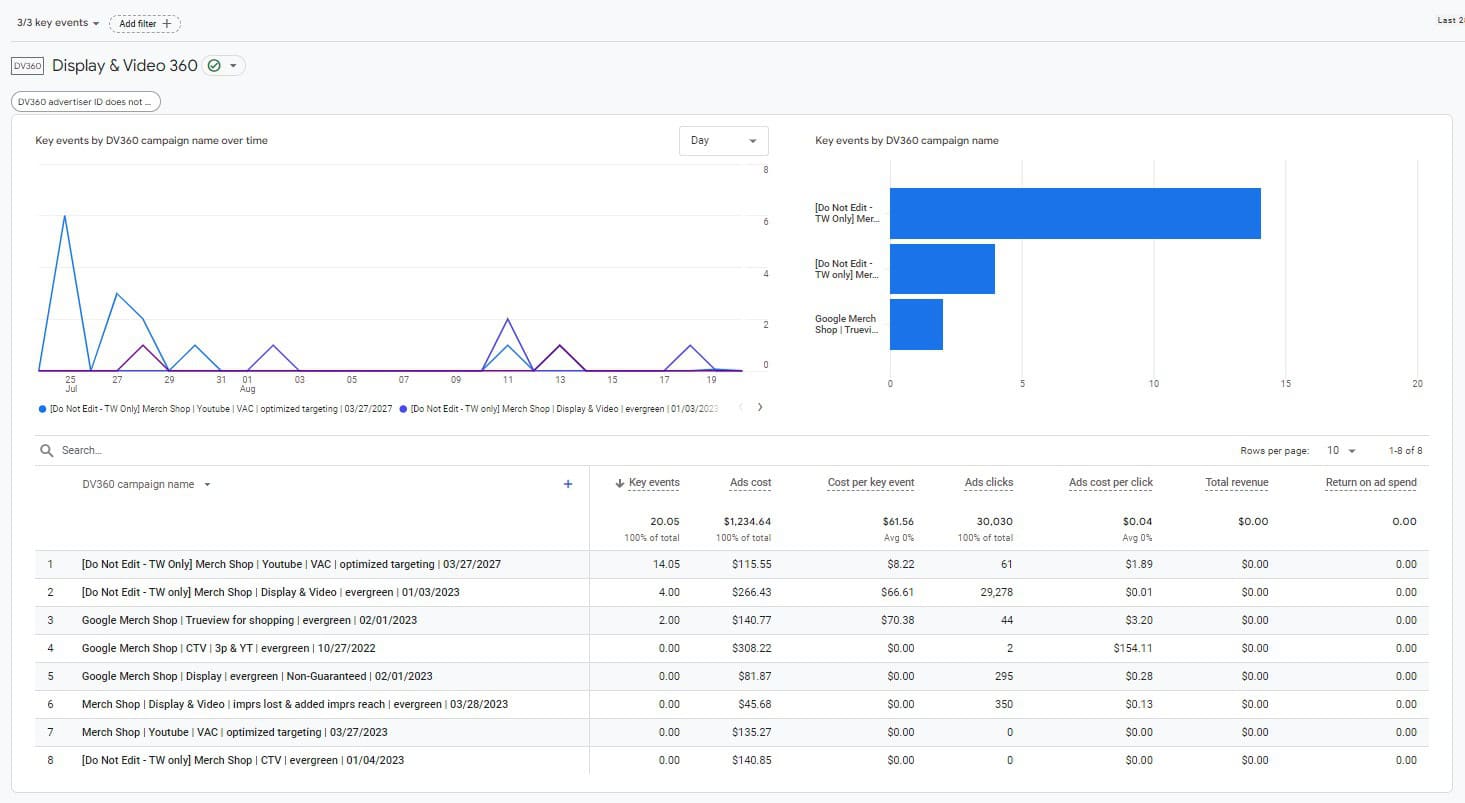
You can find this report in “Advertising -> Planning -> Display & Video 360.”
6. Google Ads Report
With this top-level Google Ads report in GA4, you can review key events, ad costs, and other metrics by campaign.
You can also personalize this report and sort by dimensions such as campaign ID, Google Ads query, and other important data points.
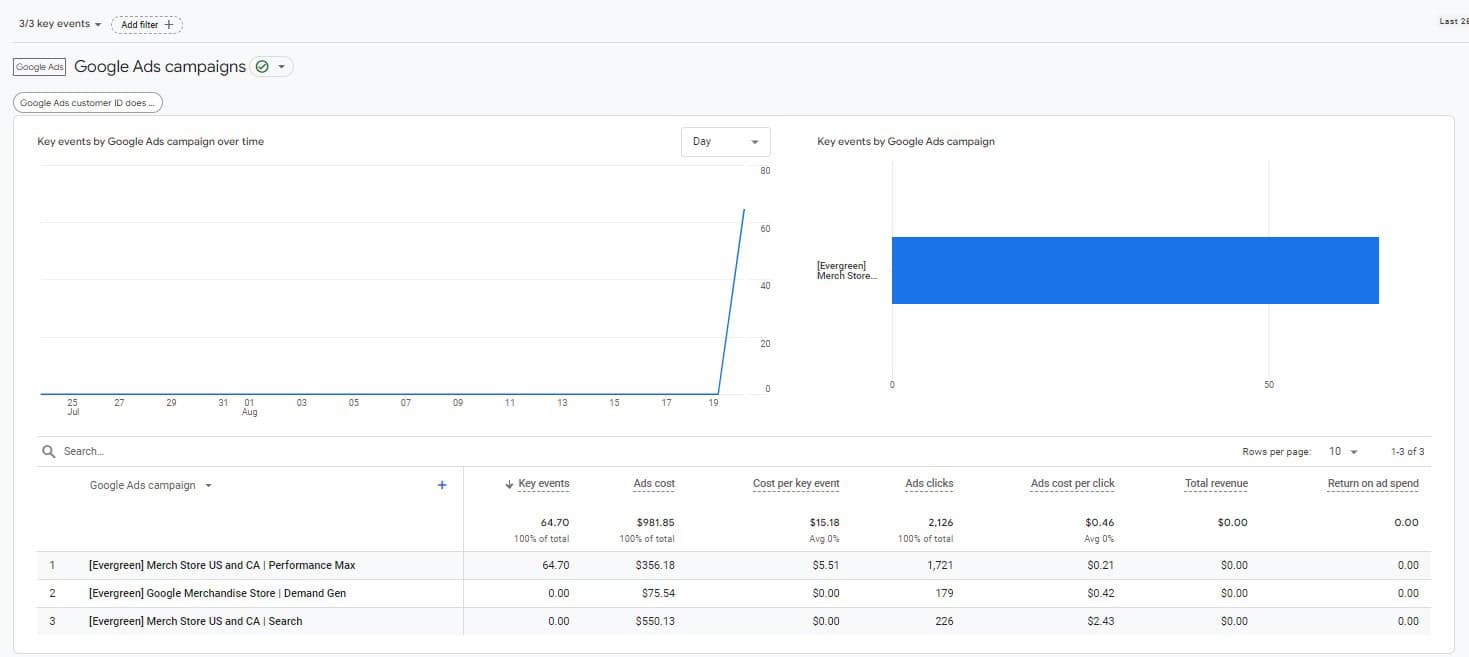
Both the Google Ads and Display/Video 360 Reports can take a while to load, due to the communication required between the two different platforms. So, while these reports are great for overall performance analysis, it can often be faster (and more comprehensive) to review your campaign performance within the Google Ads platform itself.
Within GA4, you’ll find the Google Ads report in “Advertising -> Planning -> Google Ads.”
7. Advertising Segments
Finally, Advertising Segments is a brand-new GA4 Google Ads report that dives deeper into any GA4 audiences that are synced with other Google products for remarketing ads.
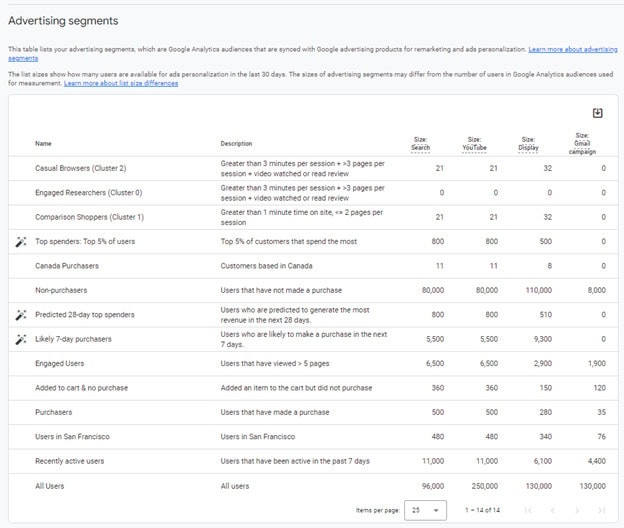
Like the other reports in this guide, the Advertising Segments report is designed to be a snapshot of overall performance (in this case, audience sizes) — highlighting some areas where your PPC team can dive deeper into targeting and segmentation within the Google Ads platform.
You can find this report in “Advertising -> Tools -> Advertising Segments.”
Get a Personalized Google Ads Reporting Dashboard
While these Google Ads reports in GA4 are great for high-level performance analysis, the best understanding of your campaign performance will come from an integrated review of both the GA4 and Google Ads platforms.
However, knowing where to find all of this data is just half the battle.
To best optimize your campaign performance, you need a team who can analyze all of these data sources — experts who know what to look for and who can quickly identify the biggest areas of opportunity for your brand.
As an industry-leading GA4 agency, Inflow can do just that.
Our GA4-certified experts can build a custom Looker Studio dashboard that incorporates all the data most valuable for your internal team, using Google Analytics, Google Ads, and other key sources to highlight the information you need at your fingertips.
Get started by sharing your wants and needs in a no-obligation consultation call today:


0 Comments