One of the most important and worthwhile analyses we do when we onboard new clients is our Seasonality Analysis. This allows us to understand trends and shifts during the year — not only for the site as a whole but at the product category and the product level, as well.
Most of our clients experience the major holiday seasons, including:
- Valentine’s Day
- Back to School
- Halloween
- Christmas
- New Year
It’s especially important for us to know our clients’ particular seasonal trends for the purposes of planning budgets and campaign strategy.
Many new clients experience a major disconnect between their site’s seasonal performance and their paid strategy. We often find that previous paid marketing efforts operated in a silo, based not upon market or consumer trends but only upon paid marketing performance.
In other words, the paid campaigns were built upon and evaluated only against themselves. This can mean a lot of missed opportunities.
Below, we explain three ways potential clients can benefit from understanding seasonal trends before implementing a PPC campaign.
1. Create separate campaigns for seasonal products.
Let’s say that Client A’s plush toy sales start to pick up considerably around Valentine’s Day. We confirm this in a Google Analytics look at product performance over the last three years during the month before Valentine’s Day.
On the paid side, Client A has only a single shopping campaign covering all toys. The campaign may even be performing well and hitting its goals for Client A. This exact scenario is common — but overlooks some incredible opportunities for seasonal sales.
Breaking out plush toys into a separate campaign and focusing budget and marketing toward these in-season products can mean the difference between making goals and creating double-digit year-over-year (YoY) revenue and return on ad spend (ROAS) growth.
Check out another of our seasonality reviews for more guidance on this exact topic.
2. Compare old and new product lines.
Our Seasonality Analysis doesn’t end at the client onboarding. It’s a great opportunity to prepare your efforts pre-season and understand their effect post-season — developing insights that will better prepare you for next time.
For example, right now may be the perfect time to run seasonal analysis for Back to School (BTS) for Client B. Our report shows what product categories did really well in the three years prior, from July through September. It tells us which product categories we need to focus the marketing budget on during this period.
As we plan BTS with Client B, however, we discover that one major category that did well before is not going to be well-stocked this year. We will need to find more product categories in order to achieve the YoY revenue growth goals. Fortunately, Client B has a new product line that they hope sells well and that they will be promoting heavily with sales throughout BTS.
With this new information in mind, we still into account the product categories that will be ready to go and performed well in prior years with the right amount of budget and campaign support — while also implementing budget and campaigns to support the new product line.
In early October, after a successful BTS, we will use the same tool to understand how existing product categories performed against prior years and how our new product category performed against the other categories. That way, we can better plan for the next BTS season.
In this example, the new product line did well and showed an opportunity for growth, which indicates that we are going to have to allocate more budget toward it next season.
Check out the video below for a walk-through of the process.
You can imagine how helpful this information can be, especially if you have rigid budgets that need to be planned a year in advance.
3. Adapt to new trends.
Seasonality Analysis can also help identify any trends affecting your business because of COVID-19.
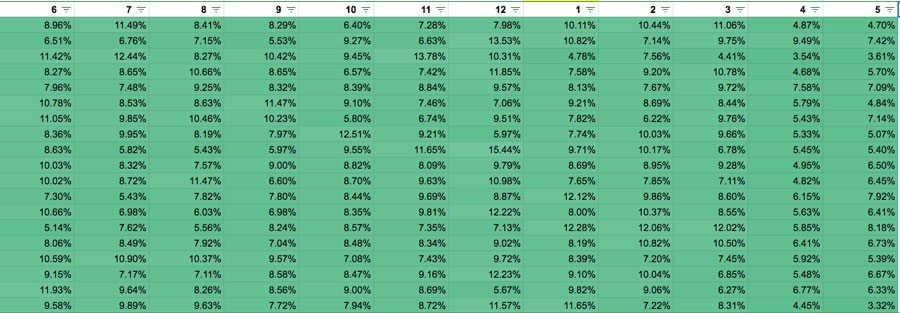
For instance, one of our clients (Client C) is showing a particular surge in performance during a season that is typically their off-season. Below we can see the percent of revenue for each month (each row represents a category). This table looks at June 2018–May 2019.

This table shows the following data:
- Each category performs relatively consistently. Because we’re looking at larger revenue figures, however, smaller shifts in percentage represent larger dollar amounts.
- For the most part, we see November–January represents more of a peak season, April–May drops off the map, and the remaining months stay fairly consistent.
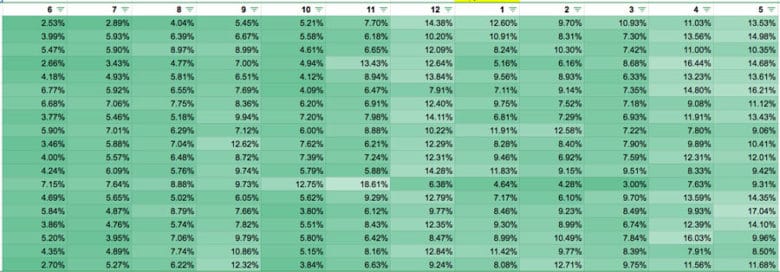
Now, if we look at June 2019–May 2020, we see a very different story:

In this case, we still see December as the peak month, except the months that were previously a low season (March–May) are now comparable with the highest performing month of December!
We can see a wave of increased performance rolling across the table above. In a situation like this, where we can’t entirely predict how long or how high this wave will last, it’s important to do a few things:
- Remain highly agile in adjusting campaign budgets and bids so you’re not limiting your impression share.
- Create campaigns for products that may not have been profitable before.
- Keep tabs on impressions and impression share to monitor demand (at least weekly) because there are no comparisons in prior seasons.
Try Out Our Free Tool for Yourself
To make our Seasonality Analysis easy for you to report and use for your paid marketing efforts, we have created a simple tool, which you can download below.
All you need is access to your Google Merchant Center account and Google Analytics. We recommend using Google Merchant Center to pull ID and Product Category data; your shopping campaigns are either structured using these IDs or their corresponding product categories.
Organizing this data by categories from your Merchant Center account will make it a lot easier for you to optimize your campaigns. We recommend this for several reasons. Many accounts might not have Enhanced eCommerce set up and therefore could be missing product categories in their Google Analytics. Or they could be using it, but the results may be too granular or too divergent from your Merchant Center structure.
We recommend looking back at a full year’s worth of data at a minimum, but three years is ideal (and it has to be complete years). Sampling may occur, so you might need to break up your look-back dates in Google Analytics and complete several downloads.
The more data you gather, the more data you have with which to understand the trends.
We are proud to offer our seasonality tool — as well as instructions for how to cut up your seasonality data in less than 30 minutes — for free. Click the button below to get started.
If you should have any questions or would like us to do a more thorough analysis of your seasonal trends, please reach out to our PPC strategists for a free consultation.


0 Comments